ClimateWatch: Mixture of pattern & chaos in DEC & SUMMER outlook (Video + 13 Maps)
3/12/2023 6:50am

> From the WeatherWatch archives
Originally Published Nov 29 — El Nino peaks in December and January, just in time for the hottest part of summer. Our final ClimateWatch for 2023 focuses on pattern and chaos.
We can see more high pressure belts and drier areas setting in…but the chaos factor (mostly fuelled by warmer than average air and sea temperatures in many places away from NZ) means we have more chances of rain than we usually would in an El Nino Summer.
For most this is a positive.
Long range data isn’t perfect at all – but the data we use is the most accurate on earth. It’s helpful at painting a general big picture of highs and lows and where they are trending and what that means for rainfall and temperatures. For NZ we’re small in the big scheme of things – we can always buck the international trend. But our latest data backs up what we saw earlier this year – that spring would be more spring-like and Summer has higher chances of drying out for the eastern and inland parts of NZ, in particular the North Island and upper South Island.
For the most part NZ leans drier in the North Island once we get to January…but December may still see a few rainmakers into the wet east (southerlies do that, so too do easterlies).
Generally speaking it’s a positive forecast for NZ’s growers and farmers…but worth noting the main concern for dry weather looks to be building over the next 3 months around the North Island and upper South Island.
We’ll continue to monitor this and if anything big changes in December we’ll let you know with a news story and big headline. We’re about giving you the best data we have at the time – but we’re not magic and can’t lock in 2024’s weather. We provide these long range forecasts out of demand, rather than us having the silver bullet answer. So we use the most accurate forecast data on earth plus then put our finger on the pulse of local weather patterns (chaos factor) and try to build that Big Picture for you from that.
Have a great start to summer – our next ClimateWatch Video will be in 8 weeks time (Jan 31/Feb 1) and our news content doesn’t stop over summer on both our websites.
- RuralWeather.co.nz / WeatherWatch.co.nz
THE MAPS…
AIR PRESSURE IN DECEMBER


EL NINO…


THE BIG PICTURE…
RAINFALL

Data Exclusive to WeatherWatch/IBM.

Data Exclusive to WeatherWatch/IBM.

Data Exclusive to WeatherWatch/IBM.

Data Exclusive to WeatherWatch/IBM.

Data Exclusive to WeatherWatch/IBM.

- ClimateWatch is a premium product made by WeatherWatch.co.nz for RuralWeather.co.nz – in association with our official business partnership with IBM.
- WeatherWatch.co.nz is proud to be a small Kiwi business providing unique services to help farmers, growers, tradies and businesses across all parts of New Zealand – both private and public sector. We thank MetService, MetOcean and Australia’s BoM for their additional data. We hope NIWA – a 100% NZ tax funded Crown Agency – will join us all some day too. (We hope the current independent Government review addresses NIWA’s excessive commercial nature).
- Please Contact Us if you need unique commercial weather, climate and data services tailored to you.
Comments
Latest Video
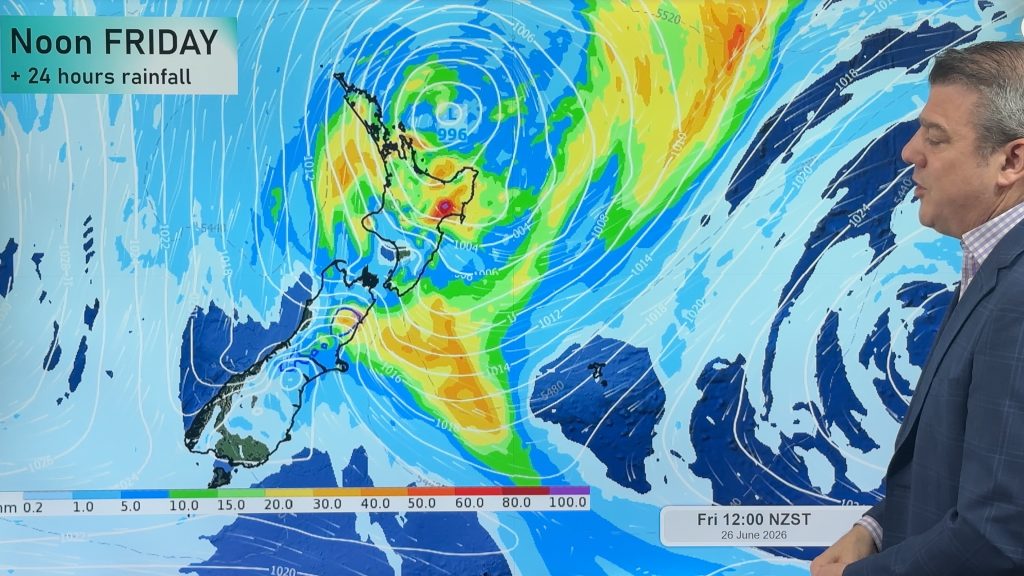
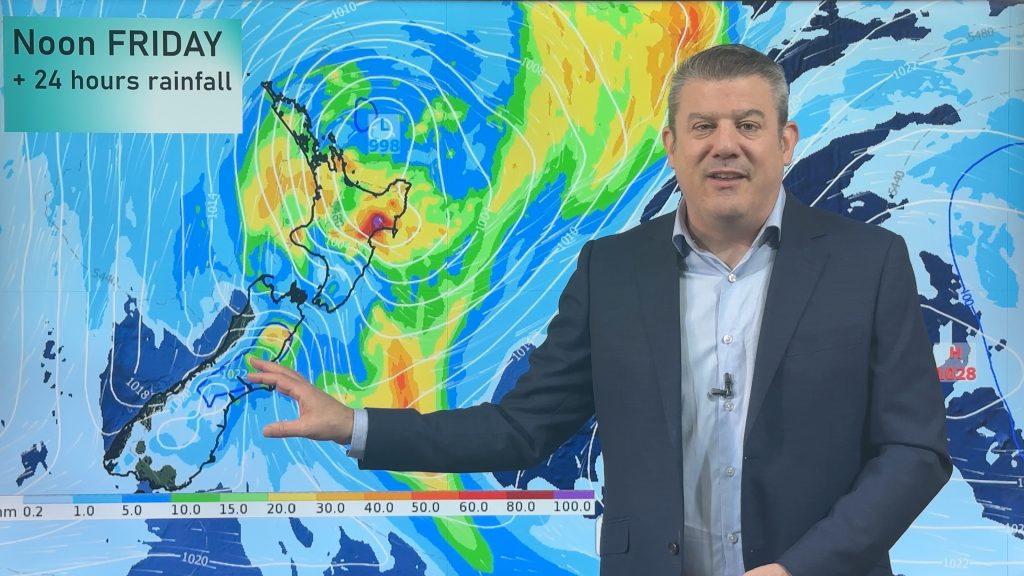
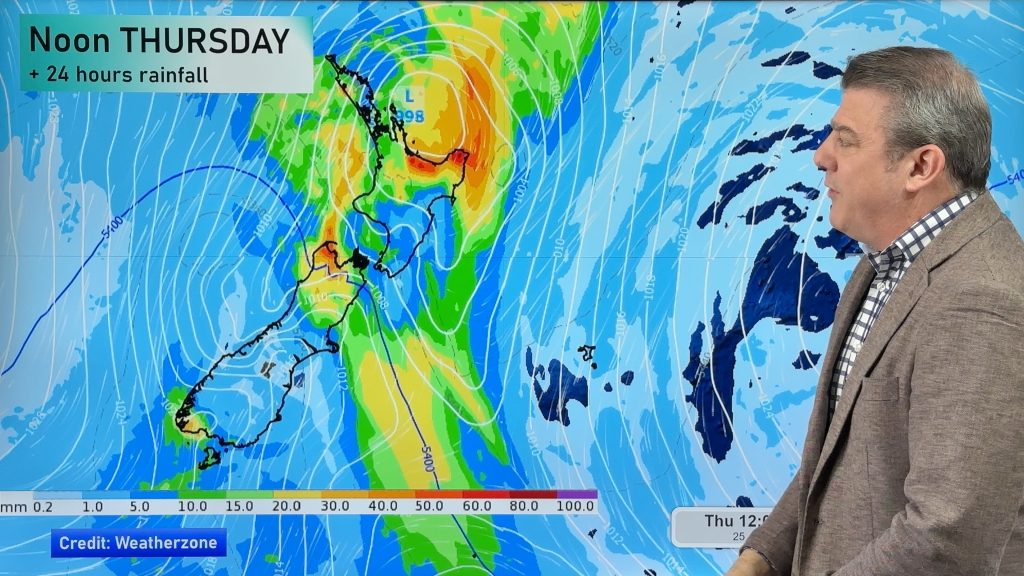
Slow go for northern low & southern cold
For the next few days low pressure will crawl over the upper North Island, driving in rain as far south…
Related Articles
Slow go for northern low & southern cold
For the next few days low pressure will crawl over the upper North Island, driving in rain as far south…
Slow moving low to track over northern NZ
A low pressure zone will slowly cross the North Island over the coming days, bringing hit and miss pockets of…
NI low pressure, SI polar change
Low pressure will move over the upper North Island this week, bringing hit and miss pockets of heavier rain into…


bob on 2/12/2023 9:12am
yep I’m watching
Pattern and chaos, makes the weather go round
WW Forecast Team on 2/12/2023 8:40pm
Wow! Unexpected 🙂
Thanks Bob – will have to up my game knowing you’re watching.
Cheers
Phil D