ClimateWatch: March sees La Nina continue to fade (+11 Maps + Video)
28/02/2021 10:14pm

> From the WeatherWatch archives
March is here and now the Autumn weather pattern will continue to expand as summer weather continues on for some, but increasingly shows signs of fading.
THE TROPICS:
The tropics will be very busy for the first 10 days of the month north of NZ with several lows developing. This will make for very high rainfall accumulations (200 to 300mm) north of New Caledonia, especially as a tropical cyclone will likely form in the Coral Sea area this week and then track east to south eastwards (towards New Caledonia) during Week 2.
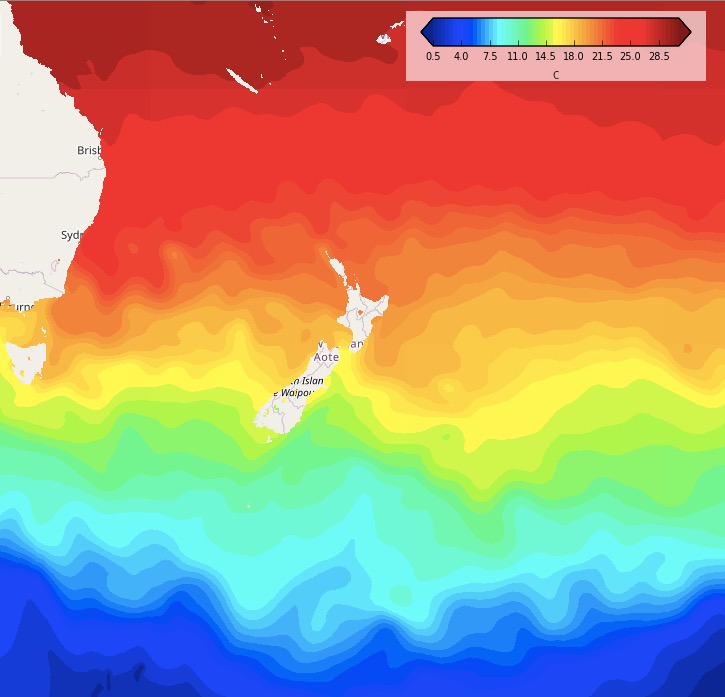
Click here for interactive sea temperature maps.

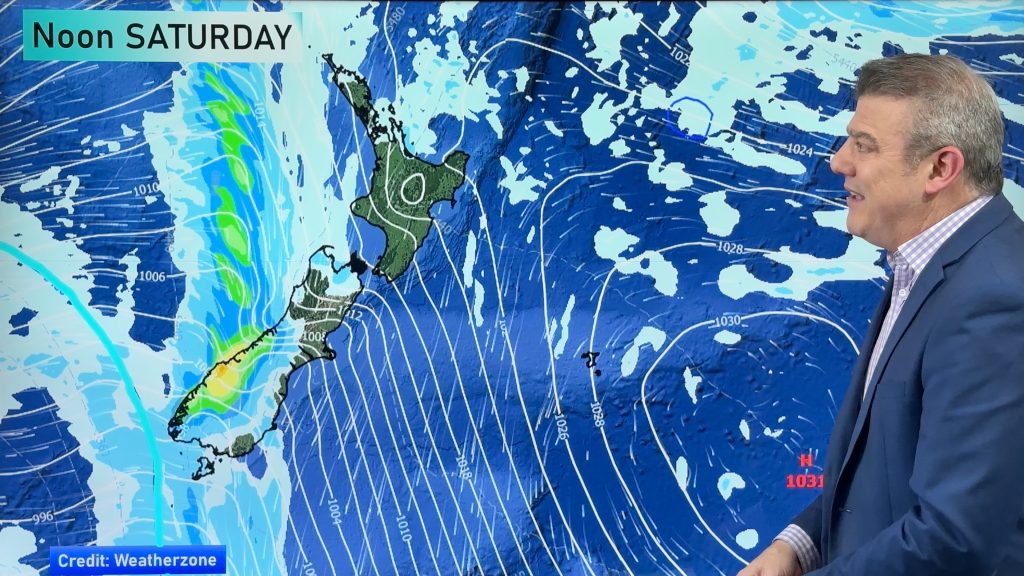
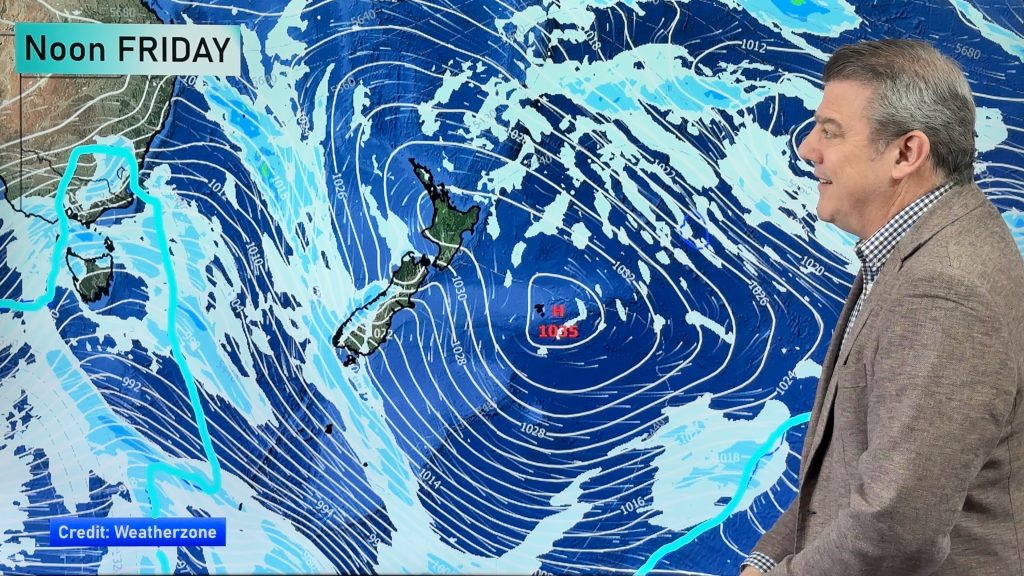
THE SOUTHERN OCEAN:
South of NZ is about to get very stormy again. For those who followed our January update we were talking about how stormy the Southern Ocean was, with not just large lows but powerful low air pressure too. In February that all eased. But March looks similar to January with some big storms in the Southern Ocean injecting more windy westerlies into the South Island and lower North Island, along with some colder southerly changes.
MARCH SET UP – NEW ZEALAND, AUSTRALIA, SOUTH PACIFIC:

Week 1: This map shows the tropics very busy in Week 1 of March. The Tasman Sea is also seeing low pressure.

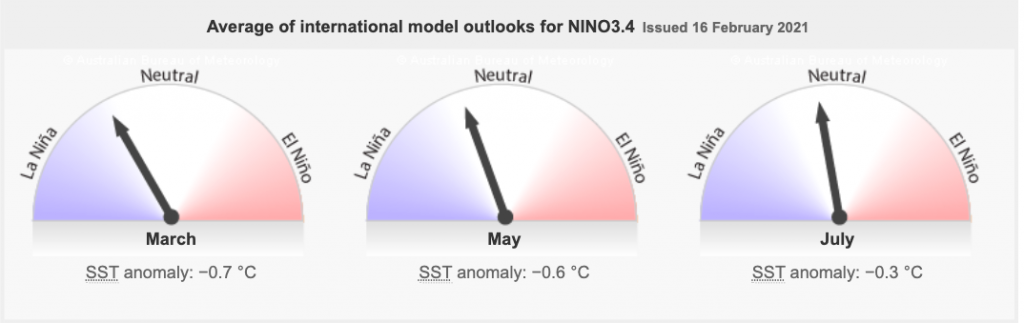
LA NINA:
Scientists we trust at Australia’s Bureau of Meteorology (BoM) have their next main climate update on Tuesday March 2. As of this update they have been consistent for many months forecasting La Nina would be a moderately short lived event this time around. BoM’s accuracy continues on with this event.

RAINFALL:

Red = Drier than average. White = Normal rainfall. Blue: Wetter than usual.
The eastern side of NZ looks driest, especially Canterbury. But many western areas return to normal rainfall, or even a little above normal for Week 1 of March.
Data with many thanks to the US Govt as NIWA in NZ won’t share this data.


TEMPERATURES:
Despite some colder injections (especially the end of Week 1 of March and first weekend) the month ahead still leans warmer than average.

This monthly ClimateWatch report is brought to you by www.RuralWeather.co.nz and IBM, in conjunction with WeatherWatch.co.nz
Latest Video
Low pressure heading to NZ this weekend & into next week
Many regions have settled weather at the moment with frosts as far north as Auckland this morning, but still some…
Related Articles
Low pressure heading to NZ this weekend & into next week
Many regions have settled weather at the moment with frosts as far north as Auckland this morning, but still some…
Colder nights/mornings, polar change coming Sun/Mon
The nights and mornings ahead will be colder in a number of regions – but an even colder change is…
Frosts, clearer skies coming – severe weather possible this weekend
High pressure lies south of NZ today and that placement encourages a colder south-east wind into the North Island bringing…

