Your web browser (Internet Explorer) is out of date. Some things will not look right and things might not work properly. Please download an up-to-date and free browser from here.
AUGUST + SPRING OUTLOOK — There’s no shortage of both large highs and large lows this August in NZ and Australia while La Nina continues to slowly look to return at some point.
The long range forecast for New Zealand leans warmer than average with rainfall carrying on across both main islands – especially northern NZ, where at least another 100mm is forecast in the next two weeks ahead.
Large highs continue to move in from Australia, but large lows are also mixed in.
This means the word “variety” remains in the forecast with a good mix of sunny and mild days, and windy & wetter ones. Usually variety in our weather is good for the economy with most farmers and growers receiving a healthy mixture of weather – generally speaking anyway.
Here are the maps and more details for how AUGUST, SEPTEMBER and OCTOBER are all shaping up in our part of the world.
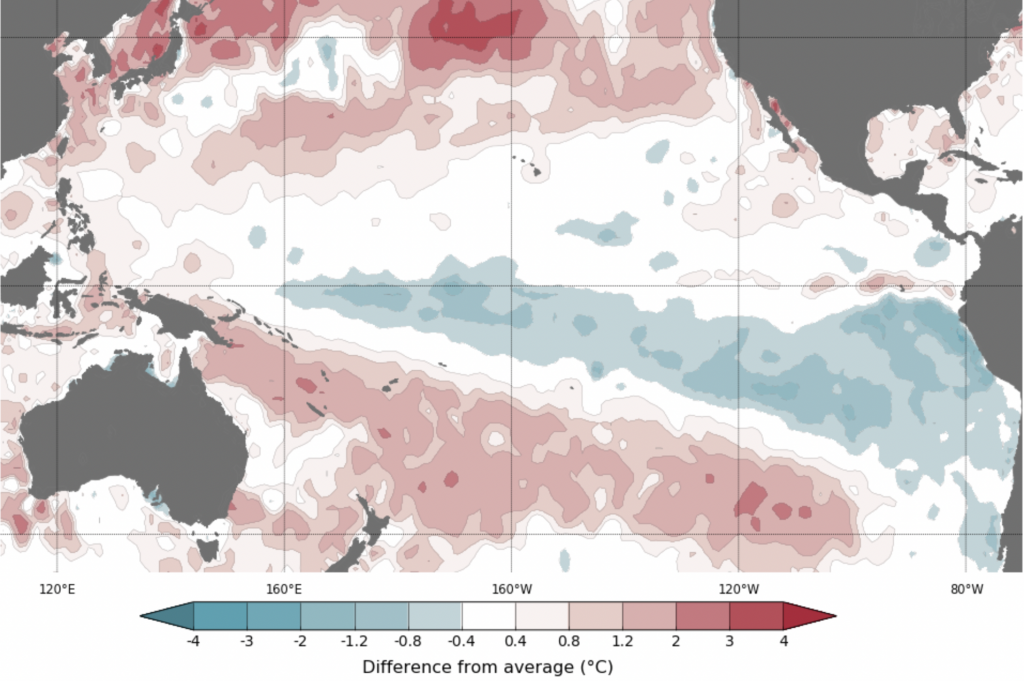
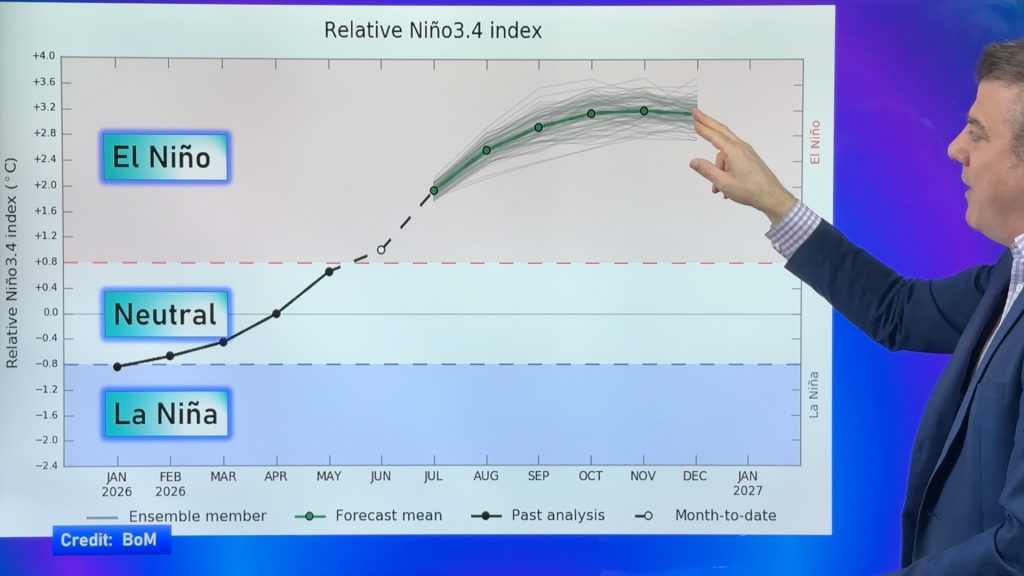
The latest from BoM (Bureau of Meteorology) out of Australia shows we’re still in a La Nina Watch.BoM’s Average of International models shows La Nina trying to return in spring… but only just. Looking at all reliable models (please note, NZ Government Agency Niwa does NOT contribute to global open data for their own commercial reasons) you can see ALL reliable international models are either in the Neutral zone (white) or leaning into the Blue (La Nina). No models indicate El Nino. Open data and Maps courtesy of BoM from Australia – with our thanks.BoM’s Sea Surface Anomaly map shows conditions around the Equator are mostly at normal temperatures now, but it’s still warmer than average around the South Pacific Islands and a large portion of the NZ side of the Tasman Sea. Warmer sea surface conditions helps fuel lows, thunderstorms and rainmakers.A closer view of New Zealand and many coastal parts of NZ remain in an official Marine Heatwave. This isn’t connected to La Nina, it’s our local sea surface temperatures showing they are a few degrees above normal in the North Island especially. Our thanks to the www.moanaproject.org/marine-heatwave-forecast – and for making public maps to share for the greater good of all Kiwis.Current Sea Surface Temperatures in NZ – www.moanaproject.org/marine-heatwave-forecast
TRACKING AUGUST’S HIGHS & LOWS…
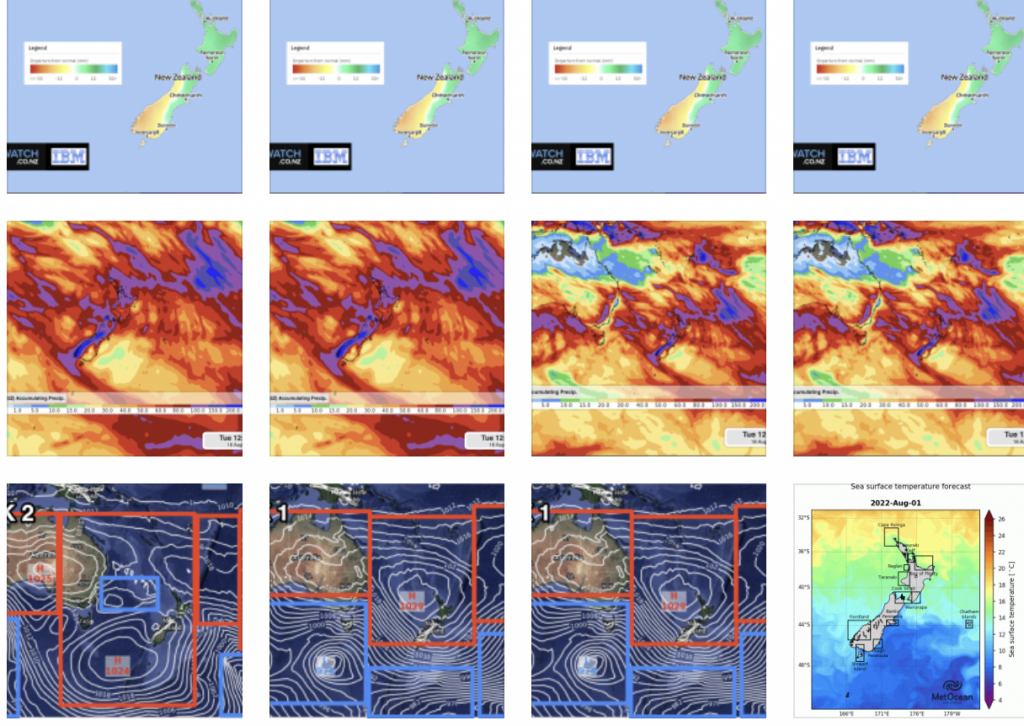
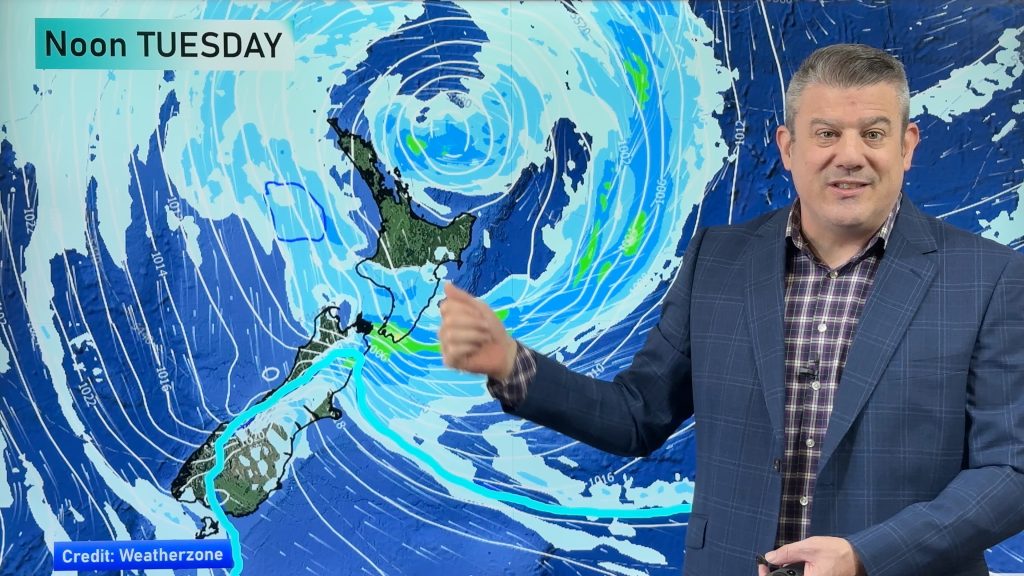
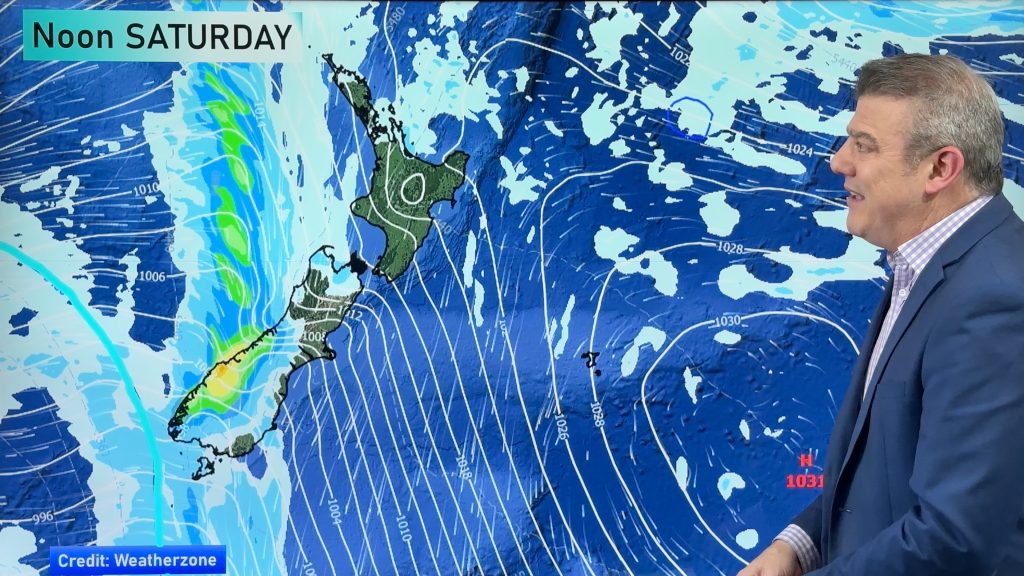
Week 1 kicks off with a lot of high pressure over Australia and northern New Zealand – even up into the South Pacific islands. However it’s balanced by some enormous areas of low pressure (and deep lows) south of Australia in this first week. This will create gales to severe gales around Western Australia (esp the southern coastline) and the coastal parts of SA, VIC and TAS. These windy westerlies will also make it to NZ, turning more wintry southerly for a time in the first weekend of August for the South Island (Aug 7th).Week 2 sees more strong highs with three of them near NZ – one to the east, one to the southwest and the other approaching from Australia. However, in the middle of these (in the central Tasman Sea) lies an area that, coupled with warmer sea surface conditions, could turn into a slow moving rainmaker / low pressure zone. One to Watch.Week 3 sees a bit of the old switch-a-roo! Now LOW pressure is covering both Australia and the NZ area while highs drift further south and north-east. This allows rainmakers to slowly move through NZ – and a low centred over central NZ can also drive in rain to eastern parts of the South Island – not locked in this far out, but shows the long range forecast has further instability.
UPCOMING RAINFALL IN AUGUST…and for the start of Spring
16 DAY RAINFALL MAP — Northern Australia leans mostly dry (again another sign that La Nina isn’t currently active) while an active line of rain from west-to-east tracks from Western Australia to New Zealand. CLOSE UP – 16 DAY RAINFALL MAP (To Aug 16) – This closer view of NZ shows 200mm+ for the West Coast and 80 to 150mm for parts of the North Island. The south eastern South Island may have the lowest totals of all for the next 16 days ahead. (GFS data). While rainfall may not perfectly pain out as this map shows, it does give a clear picture as to rain moving into NZ from the west and north over the next two weeks.Long range data from IBM Watson (the world’s most accurate forecaster) shows NZ’s rainfall this August fairly close to normal (+/- 12mm). Sydney leans much wetter than average. The warmer, slower, set up this month means rainfall totals in some pockets may be above normal (as we saw in July in NZ) so localised slips and flooding in the New Zealand area can still be expected this coming month.THREE MONTH RAINFALL – Departure from Normal. Again NZ is mostly within the “normal” range but some northern parts of the North Island look to lean wetter than average while Fiordland may lean drier. Sydney still leans significantly wetter than usual.
UPCOMING TEMPERATURE TRENDS…
AUGUST — New Zealand continues to lean 0.5C to 0.8C above average… which it has done for the past year or two.AUG – SEP – OCT — No change int he NZ area, still leaning about 0.5C above normal – as opposed to NSW which mostly leans about 0.5C below.
ClimateWatch is New Zealand’s only independent Climate Forecaster and are proud to be associated with IBM Watson – the world’s most accurate forecaster. These updates are brought to you in association with RuralWeather.co.nz and with thanks to Australia’s Bureau of Meteorology, who support open data.
RuralWeather.co.nz – backing farmers & growers who help feed New Zealanders. (Proud to be a WeatherWatch.co.nz business).
Comments
Kane on 1/08/2022 12:33am
Hey there so when does Spring officially start in NZ? Plus how bad could those winds get for Wellington tomorrow? Cheers


Kane on 1/08/2022 12:33am
Hey there so when does Spring officially start in NZ? Plus how bad could those winds get for Wellington tomorrow? Cheers
WW Forecast Team on 1/08/2022 1:28am
Hi Kane, check out this story we wrote a few years ago about Spring’s (many) start dates: https://www.weatherwatch.co.nz/content/did-you-know-there-are-actually-4-different-start-dates-to-spring
As for winds in Wellington, looks like gale NNW gusting 80 to 110km/h. https://www.ruralweather.co.nz/forecasts/Wellington,%20Wellington
Cheers
WW