Your web browser (Internet Explorer) is out of date. Some things will not look right and things might not work properly. Please download an up-to-date and free browser from here.
Despite a storm for NZ in the first week of March WeatherWatch.co.nz is expecting a drier than normal pattern to kick in for most regions as more high pressure continues to stream out of the Indian Ocean area, across southern Australia and over NZ.
El Niño + Autumn = a hat on a hat. In other words, it can make Autumn more Autumn-like, with windier westerlies, warmer weather and more high pressure.
However, our longe range NZ data plus global data suggests that as El Niño fades, rainfall closer to normal will start to return into the NZ area.
In a nutshell – March continues the dry, often summer like, weather (despite that autumn storm around March 4th and 5th), then as we go later through Autumn NZ should see a return to more usual weather patterns and a heightened chance of rain makers.
Of course long range forecasting for a mountainous island nation as small as ours in the Roaring Forties can be difficult – but the long range data we rely on most suggests Autumn may have some late silver linings for those who need wet weather before winter arrives. ClimateWatch is all about tracking monthly and longer term likely weather trends, based on the expected placement of high and low pressure zones.
The natural chaotic nature of weather systems means the longer range you go with forecasts, the less reliable they can be… a bit like how high pressure water goes down a fire hose – it starts off straight then the further down the hose the water goes the more the hose snakes back and forth.
AIR PRESSURE MAPS FOR MARCH
(there is no map for Week 4 as generally weather maps that far out are too inaccurate).
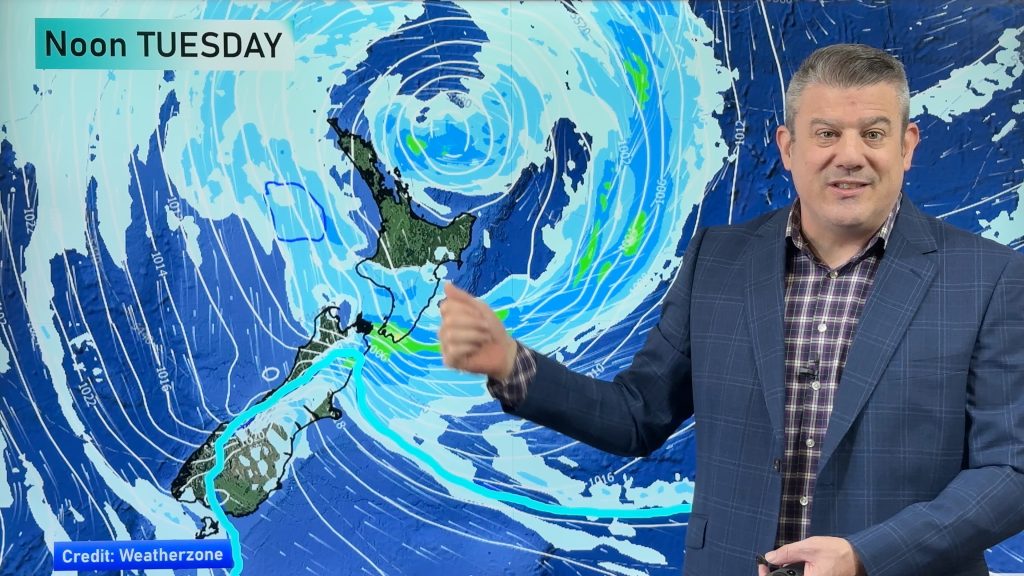
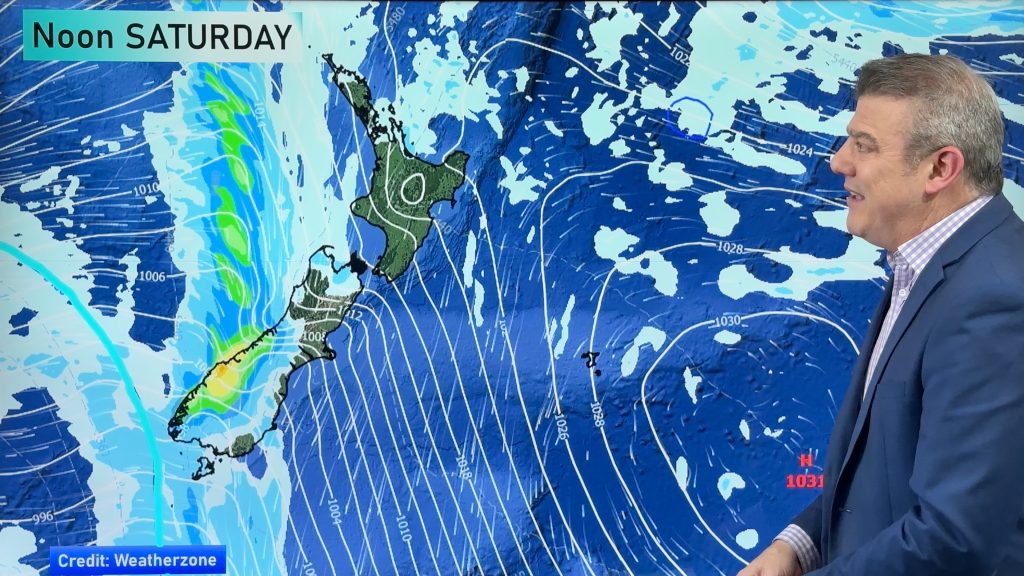
Week 1 kicks off with a lot of high pressure for our part of the world, but what isn’t showing is a significant storm in the Southern Ocean which will affect New Zealand for Monday and Tuesday (March 4 & 5). But once this storm has passed by (centred near Stewart Island), it will drop away from NZ to the south east with more high pressure coming in behind it from the Tasman Sea. (see Week 2).Week 2 kicks off on Friday March 8th and despite a storm a few days prior that low will be well south-east of NZ by the second weekend of March. More high pressure comes in – with quite an orderly look to the weather – which tends to create more high pressure for NZ (so drier weather) along with periods of windier westerlies.
Maps powered by Weatherzone, graphic by WeatherWatch.Week 3 – Looks like an extension of January and February as high pressure continues to cross southern Australia, the Tasman Sea and over New Zealand. The tropics looks busier with more low pressure, but at this early stage no big lows or storms for NZ showing up. High pressure looks to dominate March despite some briefly stormy weather for NZ from the Southern Ocean and southern Tasman Sea areas.
RAIN…
Wet weather around March 2, 3, 4 and 5 will contribute to most of this wet weather, which mainly falls on Monday and Tuesday from a storm near the lower South Island. Map courtesy WeatherzoneVery little change when you add in the following week, with high pressure likely to dominate the first 15 days of March. Rain Maps powered by Weatherzone, graphic by WeatherWatch.Big Picture and you notice the high pressure zones that keep many places quite dry, but in between these high pressure zones is the best chance for rain, either locally or moving in from the Southern Ocean or tropical zones. This map just helps show you that even with stubborn high pressure zones, rain is trying to move in/around.Our long range data via IBM shows MARCH looks similar to January and February as far wetter or drier than average weather is concerned. Indian Summer for some maybe.MARCH – APRIL – MAY – Departure from normal rain wise shows that as El Niño fades, hopefully the usual wet weather returns. Let’s be honest here, three month forecasts in NZ are notoriously inaccurate (even when we use IBM’s data – which is the most accurate on earth), but it’s still painting a picture of normality returning to most places, which is generally a silver lining for many.
SOIL MOISTURE…
Soil Moisture Levels as we go into March 2024 compared with 2023 (Please note Government Agency Niwa has made an error with the date 29th of Feb 2023 in the left hand map). What a difference a year makes … a year ago the North Island and some parts of the South Island were saturated. Not this year, with red/orange zones extending across the eastern and northern half of the South Island and a large portion of the North Island. Data via NZ Taxpayers.
TEMPERATURES…
LAND: No surprises here, most of NZ leans at least half a degree above normal for the next season ahead (March, April and May). Data via WeatherWatch/IBM.MARINE: Moana Project shows most of NZ doesn’t have a heatwave – and those that do it’s only moderate. View more from the Moana Project here.
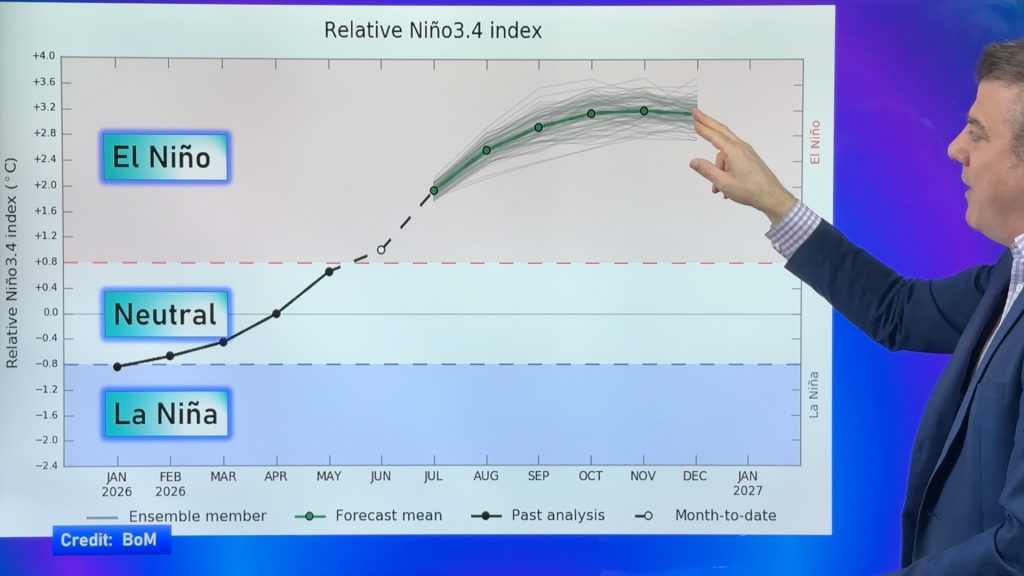
El Niño…
El Niño is still in charge of our weather patterns in MARCH.By May, hopefully we’re “back to neutral” as El Niño fades. It mean still lean a little more towards El Niño, which may still encourage more highs and windier weather for a time.Neutral by Winter… and yes, hints of La Niña according to the various Government forecasters around the world. Model of all Models – BoM’s graphic shows El Niño slowly fading away as we go through mid to late Autumn and into early Winter.