ClimateWatch – How JULY is shaping up (+12 Maps)
29/06/2021 10:43pm

> From the WeatherWatch archives
We’re now exactly halfway through 2021 (what!?) and July is kicking off on a very settled note…but will it last?
Probably not – it’s winter after all! The Southern Ocean is especially active this month (normal for mid winter) and high pressure is sliding across Australia and into the NZ region.
High pressure will kick off July’s first week, but may then be a little more northern focused, allowing westerlies to blow through for a time across New Zealand. Northern placed highs can also act like a “lid”, limiting how far north any polar blasts can go and encouraging milder westerlies instead.
Rain:
Generally speaking the month starts off very dry but may well get wetter into the second half, based on IBM’s long range global data. It shows dry weather dominating many places for the first week or two of July but then northern ends of both main islands leaning wetter. In a nut shell, this month looks a bit messy with pockets of wet weather and dry weather scattered across the country, but it’s likely eastern areas will lean drier than usual.
While the West Coast has some good totals, it’s still leaning drier than normal across the entire month, based on IBM’s outlook. In the short term, this map below (from GFS, out of America) shows the West Coast as the only region leaning wetter than usual for the first seven days of July.


The darker blue/purple shaded areas are 100 to 200mm

Temperatures:
Once again NZ leans slightly milder than average, unlike our neighbour’s in Aussie.

Soil:


Visit RuralWeather.co.nz to see this soil moisture map (updated daily).

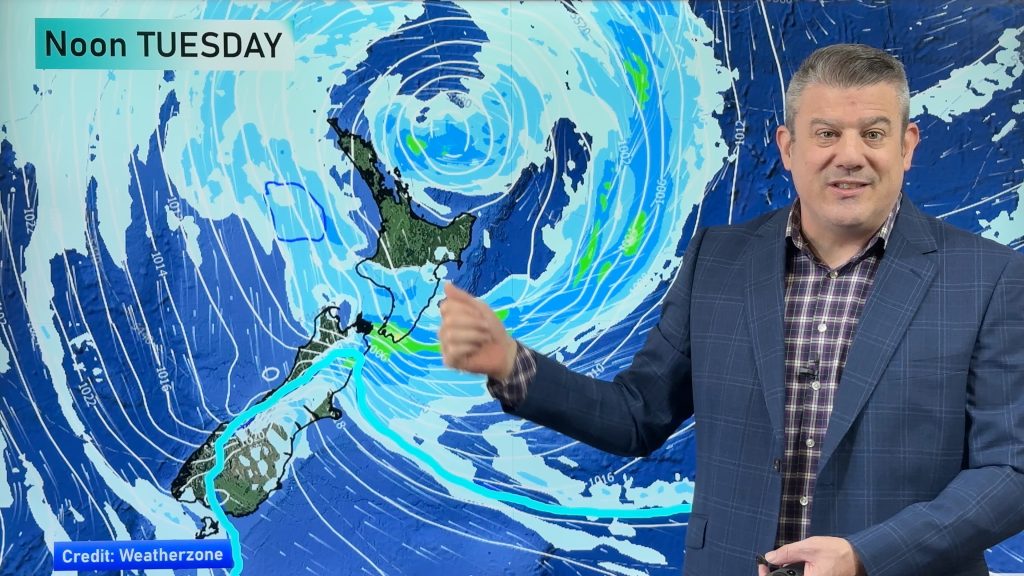
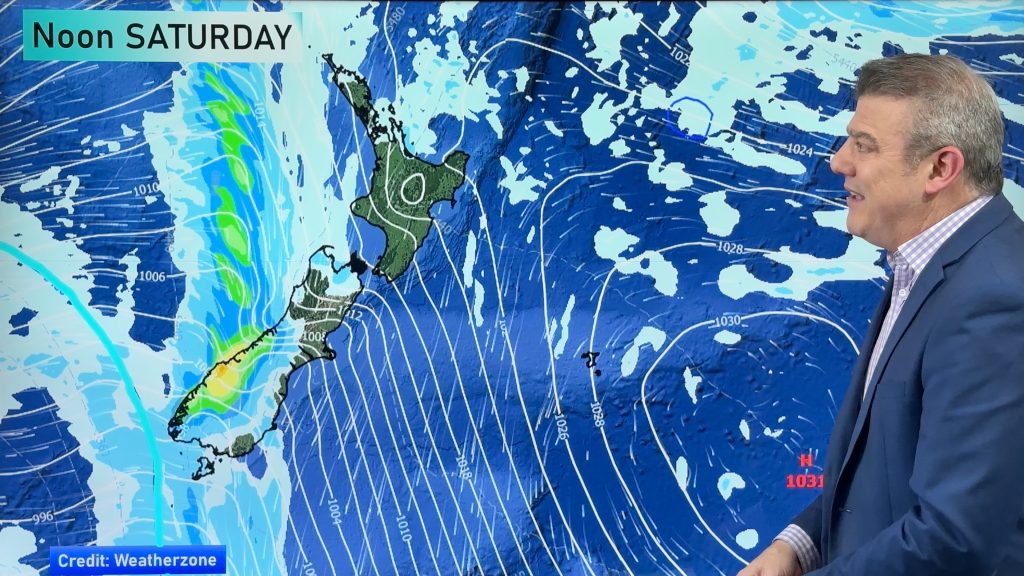
Future Maps:


Climate Driver Update:


This ClimateWatch update is proudly brought to you by WeatherWatch.co.nz and our business partner IBM.
Latest Video
Wintry weather coming: Snow, rain, wind & sunshine
A cold front is moving into NZ from Friday to Sunday with low pressure developing west of NZ and then…
Related Articles
Wintry weather coming: Snow, rain, wind & sunshine
A cold front is moving into NZ from Friday to Sunday with low pressure developing west of NZ and then…
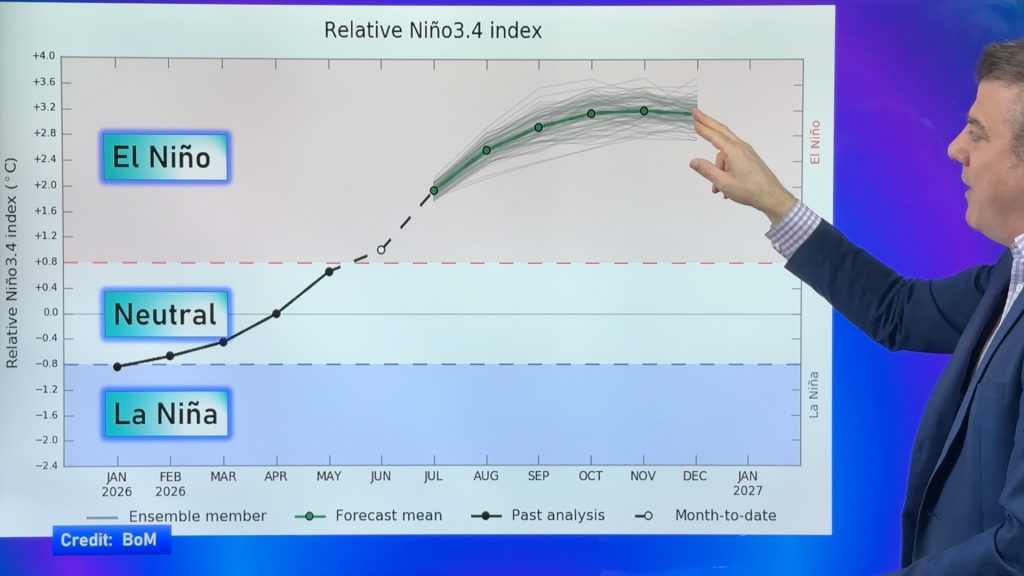
ClimateWatch: JULY outlook & what El Niño means for NZ
El Niño is officially here and still getting stronger in the months ahead, but it’s harder to notice its effects…
Low pressure heading to NZ this weekend & into next week
Many regions have settled weather at the moment with frosts as far north as Auckland this morning, but still some…

