Atmospheric river clawing its way back (+4 UPDATED Rainfall Maps)
31/01/2023 12:35am

> From the WeatherWatch archives
MAPS UPDATED 1:35pm Tuesday — Heavy rain is in the forecast again, but may also impact new areas – so what are the most trusted global computer models saying?
Last Friday’s intensity wasn’t captured by most models – but some did pick it (like the Australia model ‘Access’).
“Weather computer models are a bit like our world’s top rugby teams. The top four can all be very good most of the time, they can all having winning streaks and they can all have losing streaks. The team that won the last five times in a row may not win the next one” says head forecaster Philip Duncan. “When you watch the final World Cup of any sport, the tension you have watching is often knowing both could win or lose”.
“As forecasters, we look at these various forecast models but then have to compare them to reality – looking at satellite imagery, rain radar, water vapour, current weather conditions and gut instinct too, and matching that up to the modelling. There are a lot of moving parts, and on top of all that, this current weather set-up is highly unstable, meaning it can rapidly change without much indication” says Duncan.
When you look at the various rain forecasts coming up for the next few days you can see some familiar patterns – like the rain bands that look a bit like claws, stretching out from the atmospheric river of moisture from the tropics … and in the models we have below these look like blobs of purple (or dark blue). These are the areas of intense rain and what you’re seeing are the computer models knowing there will be lines of intense repetitive rain coming in from the north to north east (called “training” – a bit like a train on a railway track, it’s storm cell after storm cell producing heavy rain that doesn’t stray from the track/path it’s on – it’s what Auckland had on Friday).
Those purple shaded areas (100-150mm) and blue (150 – 400+) show general expected rain – but thunderstorms (or heavy rain that forms like a thunderstorm, but without the lightning) can double the totals if prolonged enough.
So where is the uncertainty in the new rain forecast? The precise placement of those training lines of rain and the precise duration of rainfall.
A slight movement west or east makes a huge difference as to where that rain goes (those purple/blue ‘blobs’ in the maps below could shift across the regions in further updates – this why MetService has regional warnings, and why not everyone in those regions always get severe weather).
Sometimes much of the worst rain can remain at sea, other times rural areas only, then occasionally, like Friday, it can make bullseye with a major urban centre. “If it all stalls, due to that big high to NZ’s east, it becomes an ever bigger issue – you can then sometimes double what is forecast in the rainfall modelling. That’s the variability which can lead to some uncertainty”.
Bay of Plenty is currently showing up as perhaps receiving some of the most of the upcoming rain.
The below maps show the current best thinking as of 1pm Tuesday January 31st, for the next few days ahead – but these could still move around in the hours ahead.
What you can see quite clearly is that generally Northland, Auckland, Waikato, Coromandel Peninsula and Bay of Plenty are most at risk to areas of heavy rain, even torrential rain.
This is why forecasters can’t always 100% lock in the precise detail some people require – but it’s very clear from the modelling below (and the forecasts we have at WeatherWatch.co.nz and RuralWeather.co.nz – which update hourly and crunch ALL the models you see below) that more flooding and slips are highly likely in the coming 48 hours across parts of the top half of the North Island, especially with the ground so saturated.
When rain sets in again – track it on the rain radar for even more accuracy.
Keep up to date with MetService warnings in the link above – they cover all the regions exposed to the heaviest rain (and gales too, which may impact Auckland, Northland and eastern Waikato in particular for a time on Tuesday PM/Wednesday AM). These official warnings also auto-appear in your local WeatherWatch and RuralWeather forecasts.
NEW MAPS – updated here at 1:35pm Tuesday January 31…


Above – four of the world’s most trusted computer models, all excellent in their own right, struggling to agree on precise set up…but they all do show a general pattern of areas most exposed.
Too confusing? Simply visit RuralWeather.co.nz or WeatherWatch.co.nz to see rainfall forecasts and keep up to date with those MetService warnings.
- WeatherWatch.co.nz / RuralWeather.co.nz
Comments
Latest Video
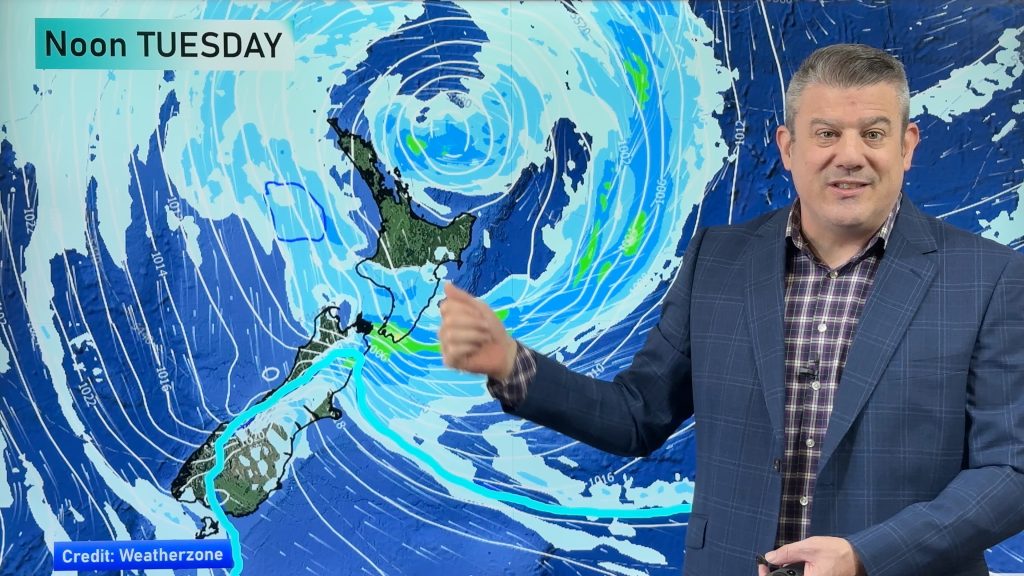
Wintry weather coming: Snow, rain, wind & sunshine
A cold front is moving into NZ from Friday to Sunday with low pressure developing west of NZ and then…
Related Articles
Wintry weather coming: Snow, rain, wind & sunshine
A cold front is moving into NZ from Friday to Sunday with low pressure developing west of NZ and then…
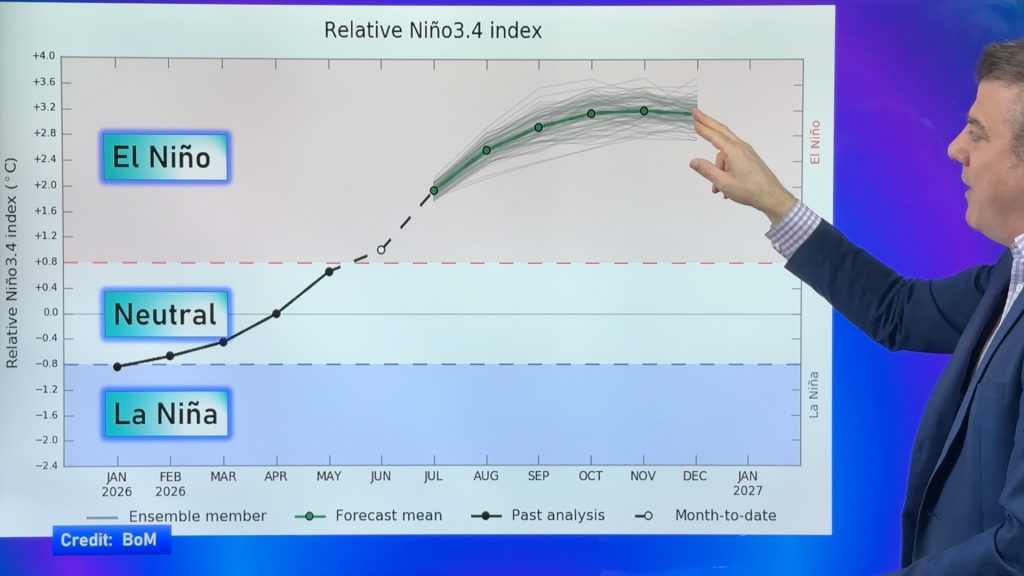
ClimateWatch: JULY outlook & what El Niño means for NZ
El Niño is officially here and still getting stronger in the months ahead, but it’s harder to notice its effects…
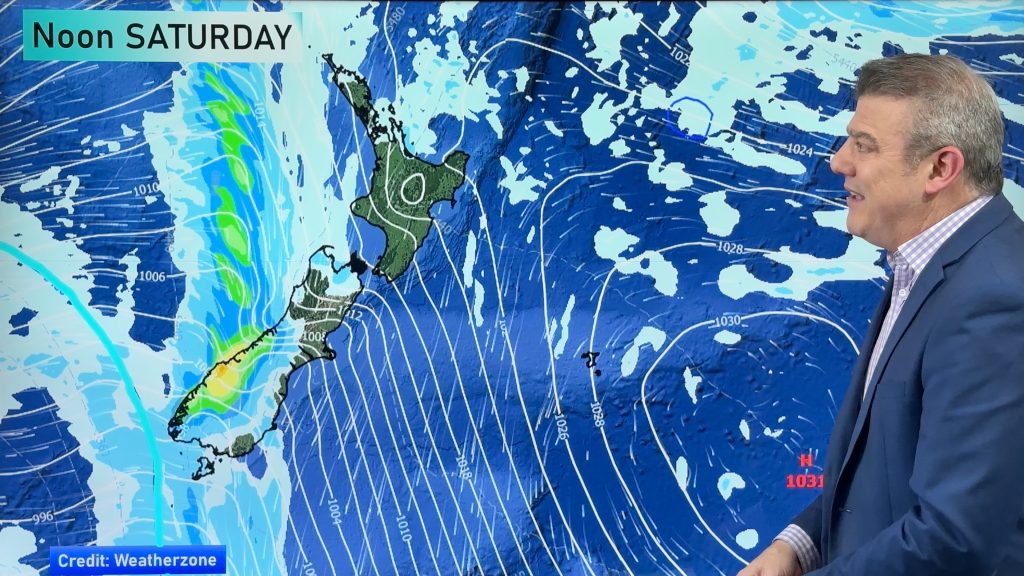
Low pressure heading to NZ this weekend & into next week
Many regions have settled weather at the moment with frosts as far north as Auckland this morning, but still some…


Nick on 31/01/2023 9:48pm
Brilliant explanation Philip. It lead me to research further and find this: https://meteologix.com/nz/model-charts
Absolutely fascinating stuff.
Terry Sanders on 31/01/2023 2:37am
Congratulations That explanation of how weather works is absolutely brilliant. I have a ticket in meteorology, and it is the first time I have watched a weather prediction explained in a language that everyone can understand and relate to. Well done. The man knows what he is talking about.