Stormy Tasman Sea Low to cross NZ this week (+10 Maps)
21/11/2020 9:44pm

> From the WeatherWatch archives
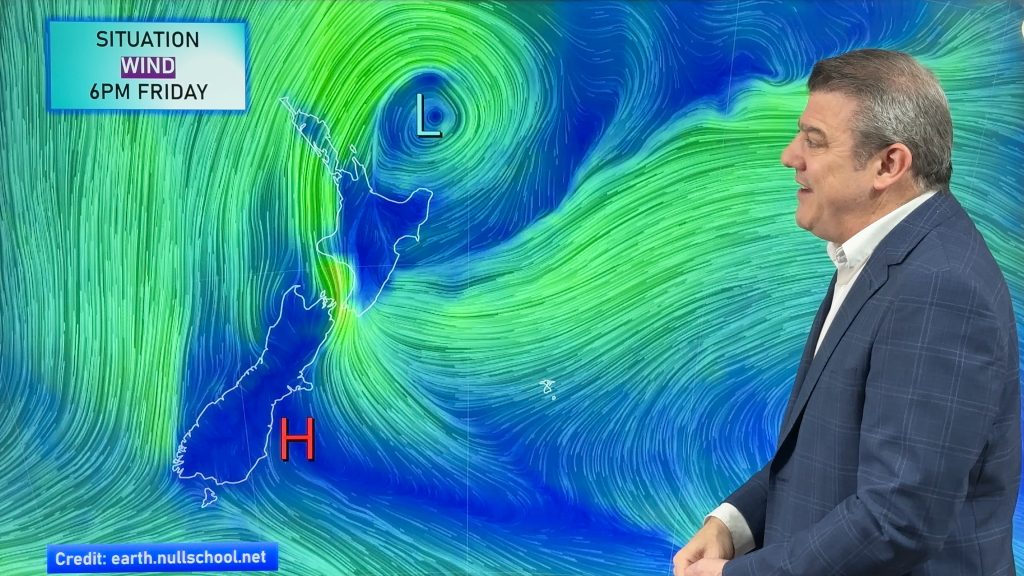
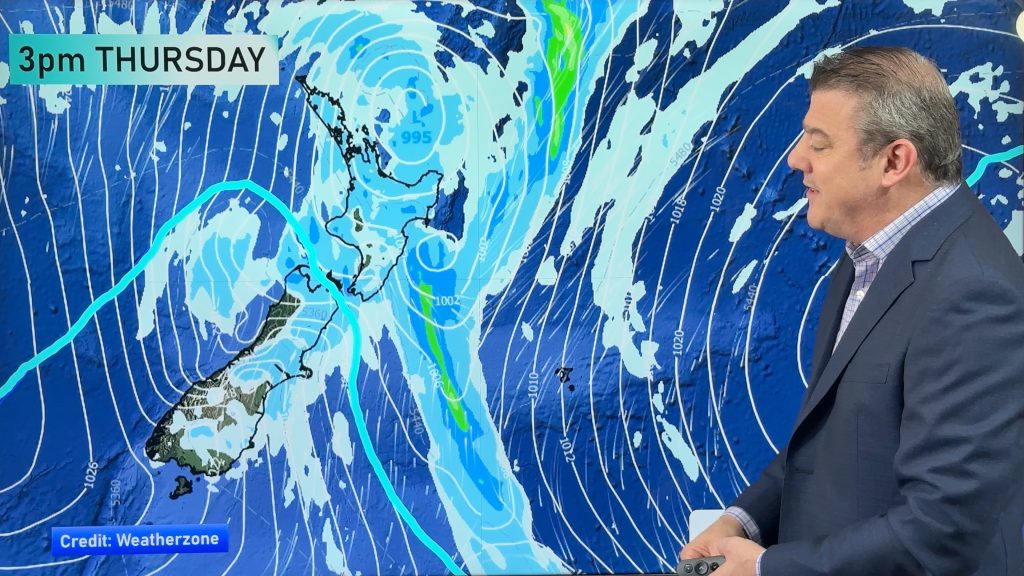
A Tasman Sea low is likely to briefly reach storm criteria in the Tasman Sea this week before partially falling apart as it moves across New Zealand mid week.
WeatherWatch.co.nz says that at sea on Tuesday the low will likely have gale force winds wrapped around the centre of it – but as it interacts with New Zealand it will lose wind speed and start to weaken.
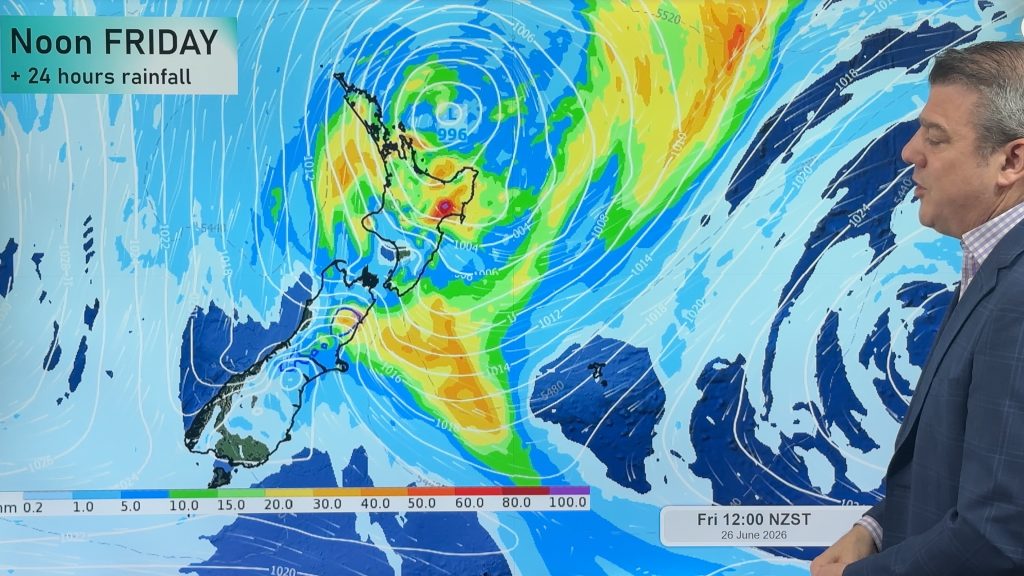
The low is expected to dump some heavy rain into parts of the country, however areas that need it most – like Auckland – may not see great rainfall totals compared to other areas further south. Still, the rain will again be helpful in our largest city which has had water restrictions in force since May.
This low matches what we said in our latest Climate/Monthly outlook for November…that La Nina would see an uptick in wet weather events for the country, but it may not be enough to help everyone.
For Wellington the run of cloudy weather continues with the cloud data in our Hourly forecasts at both WeatherWatch.co.nz and RuralWeather.co.nz showing overcast or mainly cloudy skies for a number of days this coming week. While this low may not bring gales at first to Wellington, it may leave a sting in its tail with a burst of strong to gale southerlies later this week and into the weekend.
This low is likely to trigger rainfall warnings across parts of both islands – and some wind warnings too, in the days ahead.
To make sense of this all for where you are locally, we suggest you look at www.RuralWeather.co.nz – with extra graphs and Detailed Daily Data. Also, the *hourly* forecasts at WeatherWatch.co.nz will also help make sense of rainfall totals and the windiest and wettest times coming up this week.
We’ll have more details in our Weather Video with Philip Duncan later on Monday morning.


WeatherWatch.co.nz / RuralWeather.co.nz
Comments
Latest Video
NZ: 8 Day outlook as gales & rain ease, high pressure builds
Damaging wind gusts and heavy rain will continue to affect some parts of the North Island and brushing Marlborough today…
Related Articles
NZ: 8 Day outlook as gales & rain ease, high pressure builds
Damaging wind gusts and heavy rain will continue to affect some parts of the North Island and brushing Marlborough today…
Pockets of hit & miss heavy rain, snow moves northwards
Low pressure continues to slowly move across the upper North Island and for some that will bring the sun out,…
Slow go for northern low & southern cold
For the next few days low pressure will crawl over the upper North Island, driving in rain as far south…


Josh on 22/11/2020 1:52am
Looks like Napier is out of drought with more rain than other months this year. Cantubury same.
WW Forecast Team on 22/11/2020 1:57am
La Nina usually brings in more rain for these regions, glad to see it’s happening (although Napier has definitely had too much of a good thing, not a positive when it’s delivered that fast and heavy).
— WW