Your web browser (Internet Explorer) is out of date. Some things will not look right and things might not work properly. Please download an up-to-date and free browser from here.
As we do each month ClimateWatch looks at the main climate drivers influencing NZ and Australia’s weather patterns. June was especially wet (and mild for many) in NZ with some locations receiving two or three times their usual rainfall, which means as we hit the halfway mark of 2023 a number of regions have now had more than one year’s worth of rain.
This incredible wet first half to the year has many concerned about the second half – but it looks as though ‘Mother Nature’ is going to try to do a balancing act with an increase in westerlies hopefully helping to dry out saturated, muddy, eastern areas.
But western areas (like Waikato) may still have a few more weeks of wet weather before a drier trends starts to emerge. It may not be wetter than average in Waikato, but right now – like Hawke’s Bay and Gisborne – even 5mm seems like a lot.
Following the chaos of June’s weather pattern, July is shaping up to have more order and more westerly driven weather with low pressure mostly south of NZ and high pressure mostly to our north and west.
Latest on El Niño…
At the time we recorded our Video (July 3) El Niño was still not officially announced, although it’s strongly building in the equatorial Pacific.
There currently remains a disconnect between what is happening at sea and connecting that to the atmosphere. However, long range data does suggest NZ is heading into a drier more westerly driven weather pattern over the months ahead – but July may still be chaotic with rain events for NZ, with 60 to 200mm falling in a number of regions, but totals should be closer to normal – and driest weather in the east, which is another hint that El Niño may be now slowly showing up in our atmosphere too.
As of July 3, El Niño not yet announced – it’s still building and an offical El Niño Alerts remains in place. Credit: Australia’s Bureau of Meteorology (BoM)
JULY – Computer modelling from around the world (excludes NZ’s Niwa as they don’t contribute due to NZ’s aggressively commercial stance with public science data). This shows all nations agreeing El Niño is building.AUGUST shows stronger support for El Niño developing.NOVEMBER shows all global models continue to strengthen EL Niño’s grip across the Pacific Ocean.
Graphs courtesy of Australia’s BoM.
Sea Surface Temperatures show the classic El Niño look where it’s much warmer than average in the eastern Equatorial Pacific near South America. In fact, it’s still warmer than average in the western side too (not usually the case when El Niño forms). There also remains a significant and mostly unrelated marine heatwave in New Zealand – see below.Marine heatwave intensity around Aotearoa New Zealand has eased lately, and the southerly storm of early July will help ease conditions further. However still a number of coastal areas are in a “Moderate” heatwave. This can enhance rainfall when slow moving downpours are nearby, and it can help keep overnight lows above average in coastal areas.
INDIAN OCEAN…
*NEW FEATURE*
This month’s ClimateWatch includes some additional information on the Indian Ocean. ((See our video as Phil explains in more detail)).
Basically the Indian Ocean has it’s own version of El Niño and La Niña and it’s called the Dipole. If it leans “positive” then that is like the Pacific Ocean leaning into El Niño (and negative Dipole pushes warmer and wetter weather towards Africa).
This means Australia has a double whammy of drier than usual conditions expected late winter and early spring – and this can already shut down some rainmakers in the Southern Ocean. In fact, it may be one of the reasons why the West Coast of NZ leans drier than average coming up – despite rain events still occurring there.
Indian Ocean Dipole (IOD) is leaning Positive as we go into late winter and spring. This means the eastern side of the Indian Ocean/Western and Southern sides of Australia may be drier than usual – and this may have some additional flow on effect to western NZ.MODEL OF ALL MODELS – Boiling down all the global modelling (except NZ due to commercial reasons from Niwa) to show both the Pacific Ocean/El Niño risks on the top 3 charts, and the Indian Ocean Dipole/(IOD) risks for the bottom 3. One bit of good news is that the +IOD does look to be short lived and could be fading by the time summer kicks in… when El Niño may still be strengthening.
SOIL MOISTURE…
You’re probably not shocked – but NZ doesn’t have any dry areas!! The green and yellow shading in Canterbury shows normal moisture levels. This map is owned by the NZ Public and made by a tax funded Government Agency.
WHAT IS ON THE WAY AIR PRESSURE-WISE?
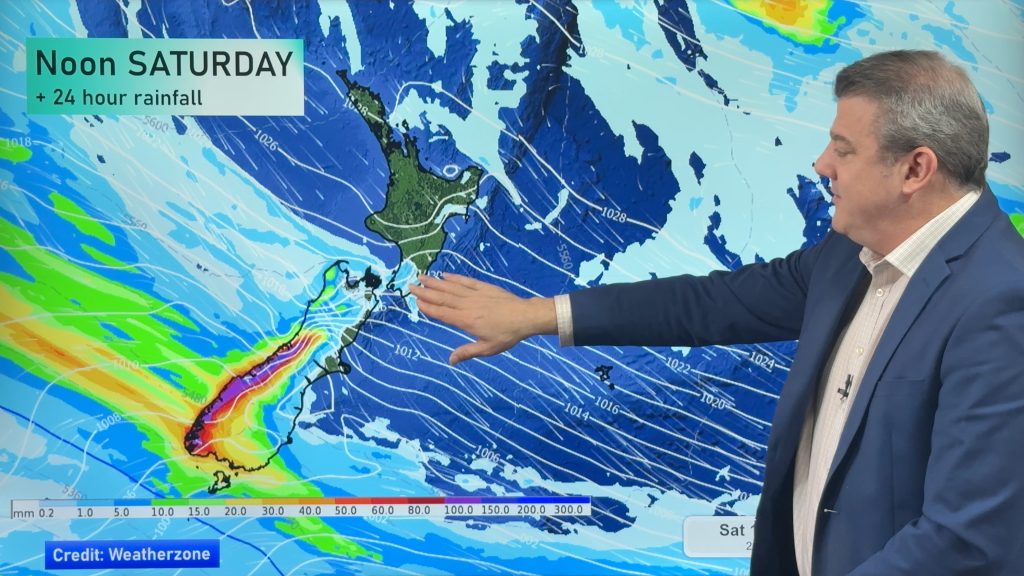
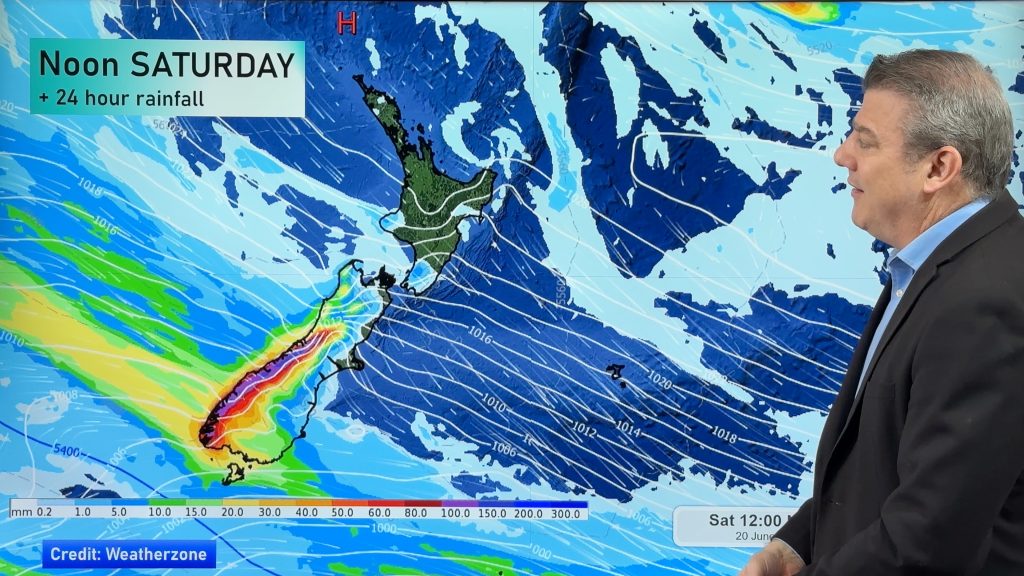
WEEK 1 – Kicks off with a big storm south east of NZ and a big high over the western side of the Tasman Sea. This puts NZ in the classic south-west ‘squash zone’ with these winds easing across the week, but generally remaining westerly. This map does look a bit like an El Niño pattern is forming.WEEK 2 – There is more order to the chaos. Yes, a large area of low pressure around NZ again, but the airflow is more westerly driven as we kick off next week, which gives eastern areas another break from the rain. The downside is that western areas that are saturated but haven’t made the news headlines as much (like Waikato) have more rain to deal with before any drier pattern might emerge.
Certainly a clear pattern of high pressure to the north and low pressure to the south seems to be forming in July.WEEK 3 – As we head in towards the latter part of July the pattern of highs to the north and lows to the south continues, encouraging more windy westerlies into NZ … and again this is another hint of an emerging El Niño pattern. This bodes well for eastern areas to start leaning drier over the coming month or so, but the downside is that western areas will have more rain before things hopefully lean drier there too.
Compared to June, July is looking much more orderly.
RAIN, RAIN, GO AWAY…
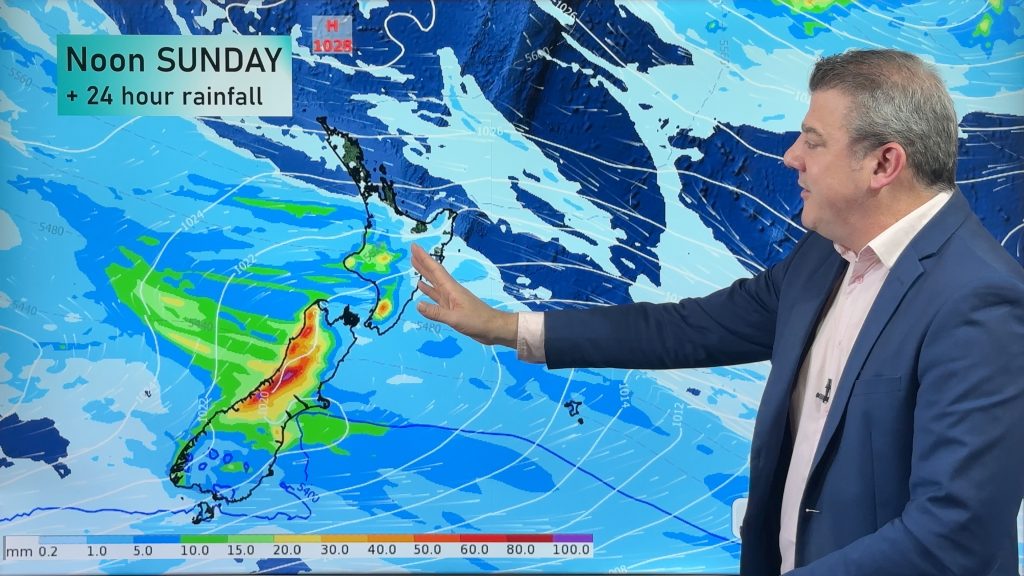
Expected Rainfall for the next 2 weeks shows that westerly lean to our wet weather showing up, with the West Coast getting the bulk of the rain (as it should do!). At this early stage there is a far more “normal” looking rainfall set up for July than we saw in June. Images Credit: GrADS/COLABig Picture: Expected Rainfall next 15 Days. The white box shows the dominant Westerly flow to our rainfall. This is a far more traditional set up. Data powered by Weatherzone & WeatherWatch.Close up NZ view… 15 Day Expected RainfallJULY Departure from Normal shows NZ still has rain, but when you combine this with the estimated rainfall maps above you can see that it may not be leaning too much wetter or drier than normal. July still has variety, but no extreme rain or dry events are yet appearing. ClimateWatch is not a weather forecast – it’s more to do with trends and climate drivers, so keep up to date with your 10 day forecasts and our regular week-day videos to keep on top of any changes that may pop up this month. But generally speaking this map shows rain still coming, but perhaps not as intense as it’s been – but that also eastern areas aren’t entirely dry yet.AUGUST – As we head further into winter the month of August is showing more of a traditional El Niño set-up for NZ with a lean to drier for many in the north, but closer to normal in the south.Long Range and the Three Month Rain Trend is for NZ to be normal to slightly drier than normal. Perhaps a gradual slide to an El Niño weather pattern, rather than a dramatic overnight change.
These IBM Long range Departure from Normal rain maps are the best guide we have on earth for long range planning, but in a country as small as ours, partially in the Roaring Forties, things can still change. While it’s the most accurate on earth, it’s still not perfect. Please use this as a guide along with your weekly weather forecasts.
TEMPERATURES…
Despite the odd cold blast, our data still exclusively forecasts this winter to be warmer than average. Something we’ve been consistently saying all year. However one change is that the very top of the North Island may be the closest to normal it’s been in a long time. This may be due to more W to SW winds and fewer northerlies or sunny/clear days coming up. April and May were 2 to 3 degrees above average in many parts of NZ, and June was remarkably mild for many places too (for this time of year). There has been a distinct lack of frosts in 2023 nationwide, but in particular for the North Island. WeatherWatch.co.nz / RuralWeather.co.nz
ClimateWatchis a premium product made by WeatherWatch.co.nzforRuralWeather.co.nz – in association with our official business partnership with IBM.
WeatherWatch.co.nz is proud to be a small Kiwi business providing unique services to help farmers, growers, tradies and businesses across all parts of New Zealand – both private and public sector.
Please Contact Us if you need unique commercial weather, climate and data services tailored to you.
Comments
Mel on 9/07/2023 4:32am
Love all your videos but I do find the international stuff super interesting, especially since we seem to only have had one weather type for the last year (mild, rain). You have done some ‘weather snapshot round the globe’ type vids in the past, a request for more please!
WW Forecast Team on 9/07/2023 7:50pm
Hi Mel, thanks for that. We’re hoping to make more interesting video content in 2024 (this year we’re focused on launching our new alerting app). Definitely something we’re keen on doing again once we get the time. Thanks for the keen interest!
– Phil D