ClimateWatch: How JUNE & WINTER are shaping up (+15 Maps & Video)
1/06/2022 7:26am

> From the WeatherWatch archives
We bring you the very latest weather & climate trends on the way for June, July and August – brought to you by RuralWeather.co.nz and our business partners at IBM.
These forecasts are independently made from a combination of both private and public data sets.
SUMMARY – UPCOMING WEATHER TRENDS FOR NZ:
In our last ClimateWatch update we said May would not be your normal May, with drier weather dominating in a number of regions, warmer than average weather for many, and even a drought was officially announced in Waikato and South Auckland.
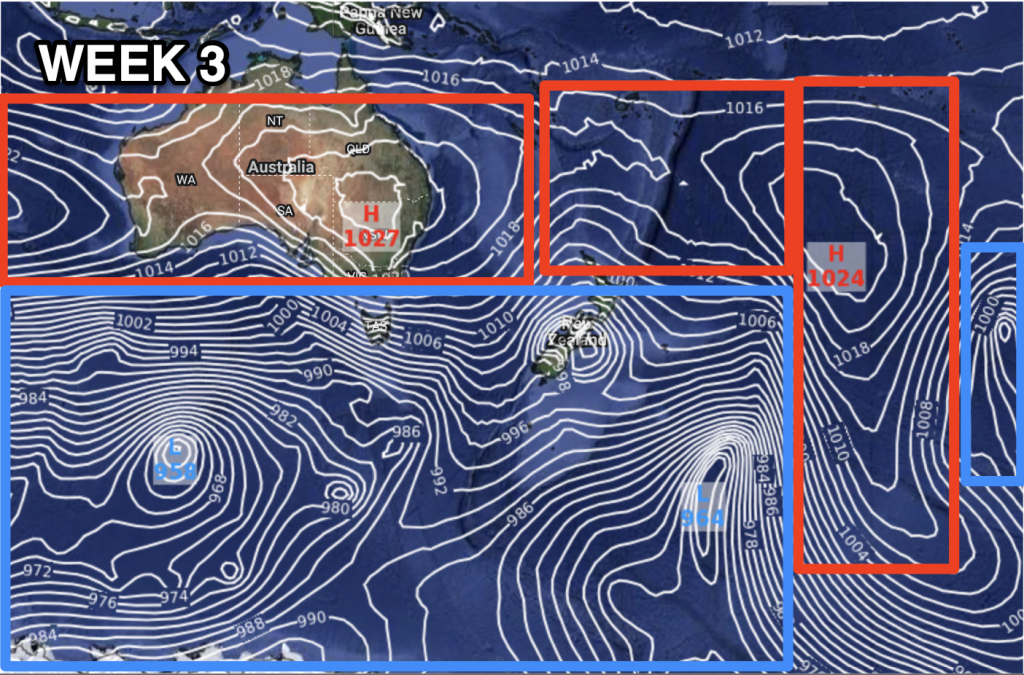
June sees a return closer to normality – however still not entirely normal. June will lean warmer than average again by 0.5 to 1C nationwide – a trend that has been going for years now. But rainfall returns closer to normal in June and across Winter. The first half of June looks to be wettest with perhaps more high pressure around the Tasman and northern NZ mid to late month.
But the long term IBM data we use for our seasonal forecasts indicates, while warmer than average, rainfall may be closer to normal in most regions this coming winter.
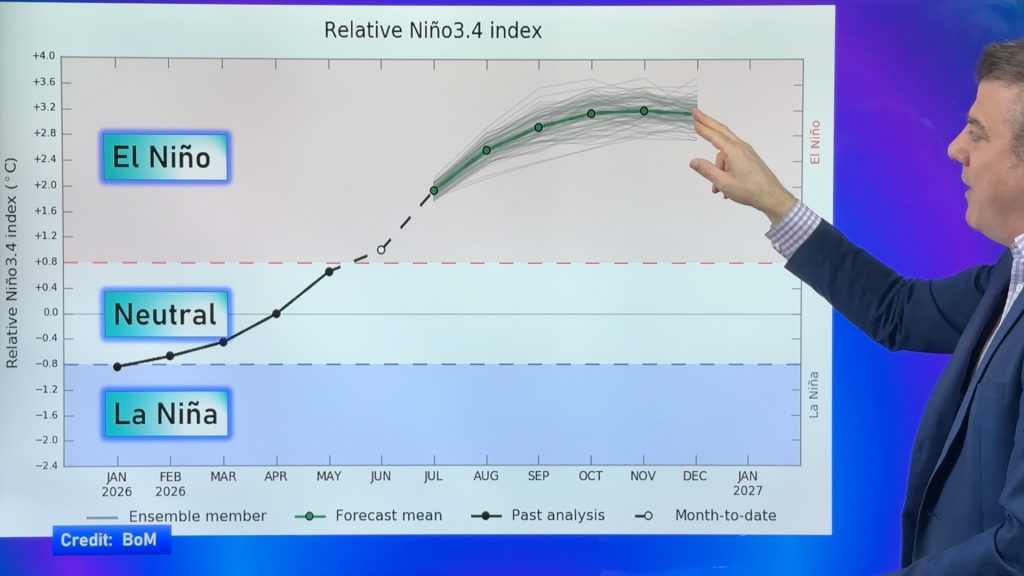
La Nina is still here – but only just. It’s expected to officially fade this winter but has a chance of returning again in spring. If this occurs it would be a triple dip La Nina, which is quite rare. A weak La Nina (as we have now) doesn’t really impact NZ much. We have marine heatwaves carrying on which aren’t related to La Nina but feel similar – some of the stormy weather coming into NZ in early June may well help churn some colder water up to surface and so we might see a return to more normal temperatures in some coastal zones.
Not all international models agree on the future of La Nina – you can see more details below and in the video, but generally speaking it is weakening and may try to come back later in the year. It’s worth noting that only if it’s a moderate to strong La Nina will that have any possible significant impact on NZ’s weather pattern.
THE MAPS…
LA NINA


Image above for JUNE (BoM).


Credit: BoM
HOW JUNE IS SHAPING UP…


SOIL

UPCOMING RAINFALL


EXPECTED GENERAL TEMPERATURES ACROSS WINTER


- ClimateWatch is a RuralWeather.co.nz product.
Comments
Latest Video
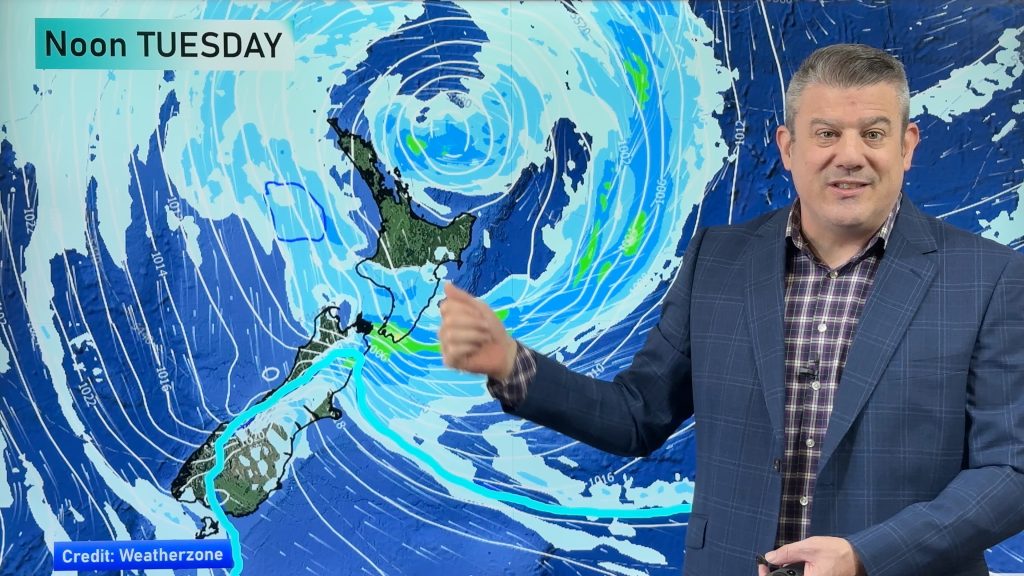
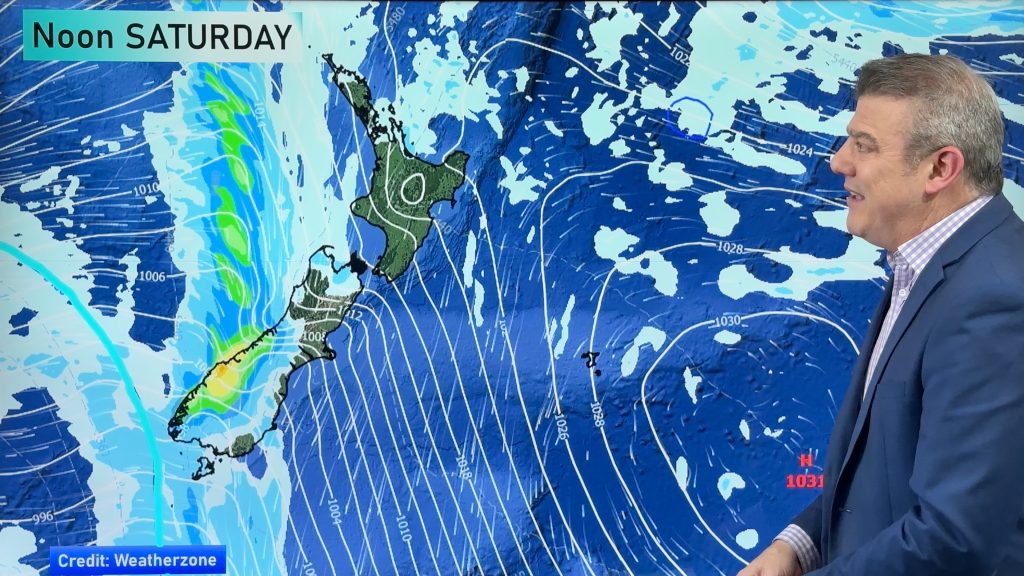
Wintry weather coming: Snow, rain, wind & sunshine
A cold front is moving into NZ from Friday to Sunday with low pressure developing west of NZ and then…
Related Articles
Wintry weather coming: Snow, rain, wind & sunshine
A cold front is moving into NZ from Friday to Sunday with low pressure developing west of NZ and then…
ClimateWatch: JULY outlook & what El Niño means for NZ
El Niño is officially here and still getting stronger in the months ahead, but it’s harder to notice its effects…
Low pressure heading to NZ this weekend & into next week
Many regions have settled weather at the moment with frosts as far north as Auckland this morning, but still some…


Rob on 4/06/2022 10:49pm
If June has been leaning warmer than average for years now then it’s time to adjust the baseline for what is average. I see the same silly stats put out by Niwa who haven’t adjusted their base line either.
WW Forecast Team on 5/06/2022 12:32am
Baseline is the past 20-30 years or so, that’s fairly short term and reflects some of the modern warming occurring too – to be constantly moving the baseline would destroy the whole point of looking back to see what was previously recorded! Some people just don’t like to hear ‘warmer than average’ regardless of the facts behind it, we remain balanced and simply giving people and small businesses the info they need to plan ahead weather-wise.
Cheers
Phil D