Very big low moves in to NZ – Canterbury flood risks & other weather risks nationwide (+10 Maps)
29/05/2021 7:56am

> From the WeatherWatch archives
Christchurch is forecast to get well over a month’s worth of rain this weekend as a very wet easterly flow starts to kick in, while further inland other parts of Canterbury may get more than double or even near triple what the Garden City is forecast to receive.
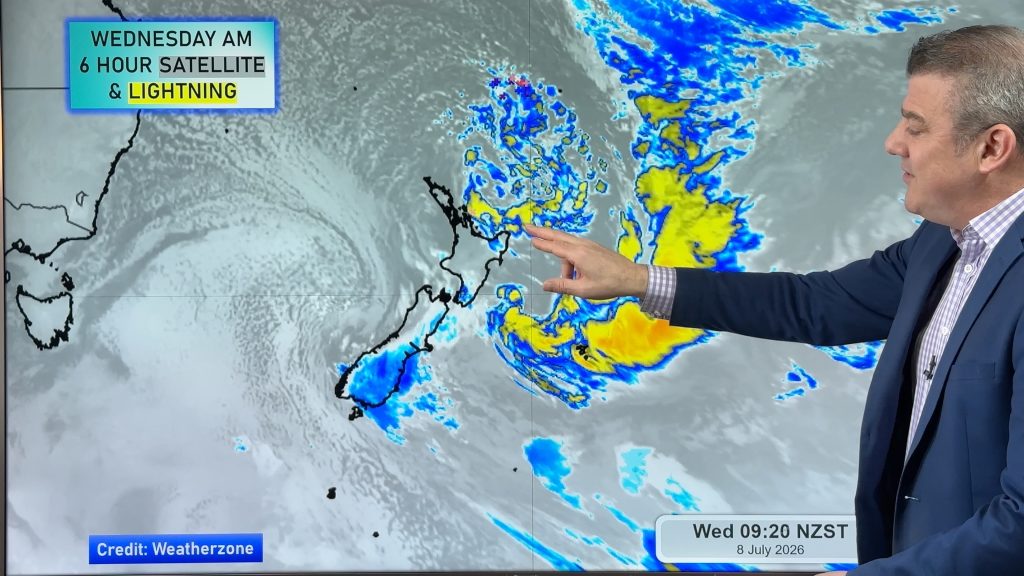
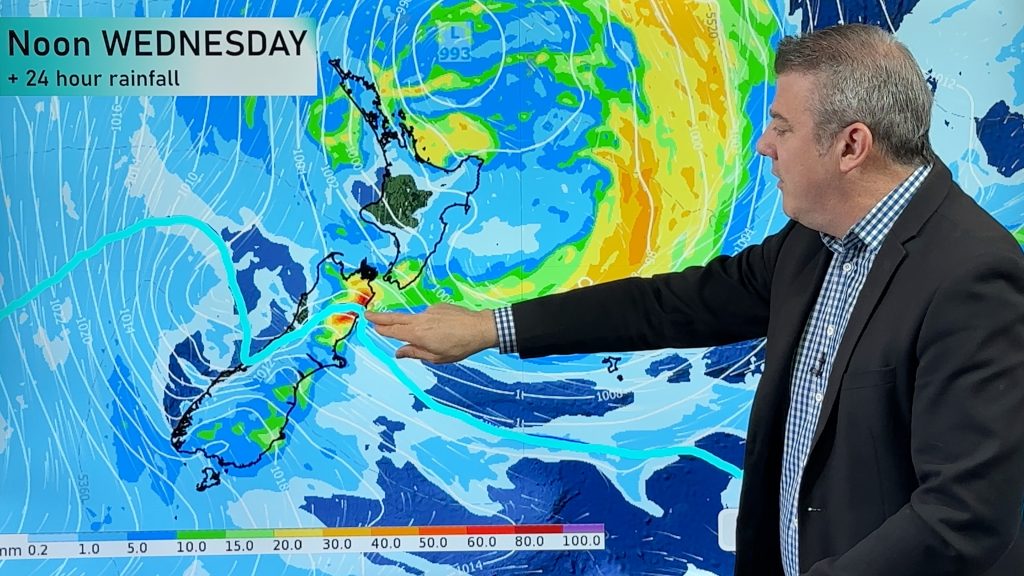
The wet easterly will push into Canterbury as part of a very large low pressure system moving into the North Island. The clockwise airflow means moisture-rich air from north of NZ will be pulled down around and into Canterbury starting today, peaking overnight and into Sunday, before slowly easing across Monday.
Christchurch normally averages 64mm in May but this weekend RuralWeather.co.nz and WeatherWatch.co. nz (which both use IBM’s supercomputer Watson) are forecasting 91mm for the city. This may change a little up or down, but generally speaking it’s a significant amount of rain forecast for the low lying quite dry city.
Further inland and RuralWeather.co.nz is forecasting even heavier rain with 87mm forecast just today for Darfield and a further 80mm on Sunday, and on Monday 19mm. This is an exceptionally heavy rain event across Canterbury and flooding and slips are highly likely this weekend.
Main Risk Area for Flooding:
Canterbury, especially between Timaru and Rangiora with highest totals inland towards the mountains/ranges but low lying coastal areas at high risk from flooding.
Main Risk Time for Canterbury Flooding:
Rain sets in across Saturday, heavier falls later today, overnight and into Sunday. Easing Monday.
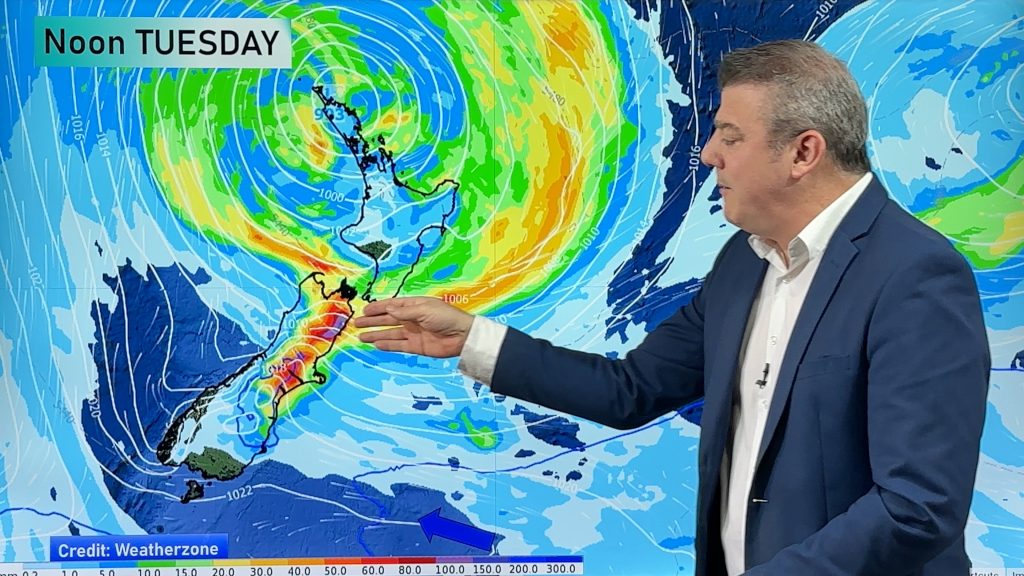
Max Totals:
WeatherWatch.co.nz is forecasting 250 to 300mm at the very peak of the rain area, across just a 48 hour period. This is an exceptional total for this normally dry part of NZ. MetService is also forecasting similar totals, with a 200 – 300mm spread across the Canterbury high country and 80 to 120mm further east across the plains and coastal areas. It’s good to see both WeatherWatch and MetService with similar rainfall totals and risk areas for this extreme event.
OTHER RISKS ACROSS NEW ZEALAND
SOUTH ISLAND SNOW:
With so much heavy rain forecast for the eastern side of the South Island, combining with a colder airflow, it’s not surprising that heavy snowfall is expected in the Southern Alps with over 1 metre of snow expected this weekend on the summits. Places like Mt Hutt may be most exposed to heaviest falls.
Snow flurries are possible on Alpine Highways, especially overnight.

STRONG WINDS
The low is large and has a fairly calm centre to it, but those on the outer edges may have gales today, tonight or Sunday – especially around Mahia Peninsula, Fiordland and through the Southern Alps, also maybe Stewart Island.

THUNDERSTORMS:
A few isolated thunderstorms have moved through the upper North Island and Auckland region this morning. More are possible over the next few days. Track live here.

See the general risk zones here:

METSERVICE:
We’re really pleased to now have ALL MetService weather warnings live updating at WeatherWatch.co.nz. This covers official Warnings and Watches, also Road Snowfall warnings and Severe Thunderstorm Warnings.

**NEW** We’re also stoked to have the MetService Thunderstorm Outlook Map now displaying live at WeatherWatch.co.nz – it’s a great product from MetService that works nicely with our own thunderstorm risk maps (which you can view here).

RuralWeather.co.nz:
If you need to visually see rainfall graphs, wind graphs, rainfall totals and temps (Both HOURLY and DAILY across your very specific local part of NZ) please visit www.RuralWeather.co.nz. We have the most accurate rain forecast data in NZ, powered by IBM Watson.

Latest Video
More eastern rain, but a drier long weekend coming
Rain continues today along the eastern South Island and lower North Island, coming in from the east with heavy falls….
Related Articles
More eastern rain, but a drier long weekend coming
Rain continues today along the eastern South Island and lower North Island, coming in from the east with heavy falls….
More heavy rain, snow – but large dry areas, especially as we go into the long weekend
Heavy rain will continue for parts of Canterbury and Marlborough over the next day or two and it will gradually…
Large low brings rain, downpours & some snow – gets colder as the week progresses
Low pressure will cross the upper North Island in the days ahead and that set-up actually pushes more heavy rain…

