NEW: July’s climate outlook: The variety continues but some gigantic highs also return (+7 Maps)
30/06/2020 10:25pm

> From the WeatherWatch archives
In May WeatherWatch exclusively and accurately forecast June would turn wet – now we’re looking at July and seeing an unsettled first half of the month along with more high pressure than normal as we head through the month.
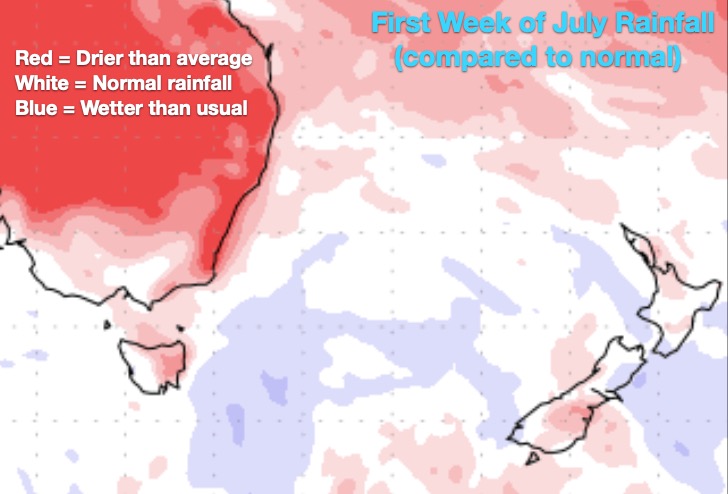
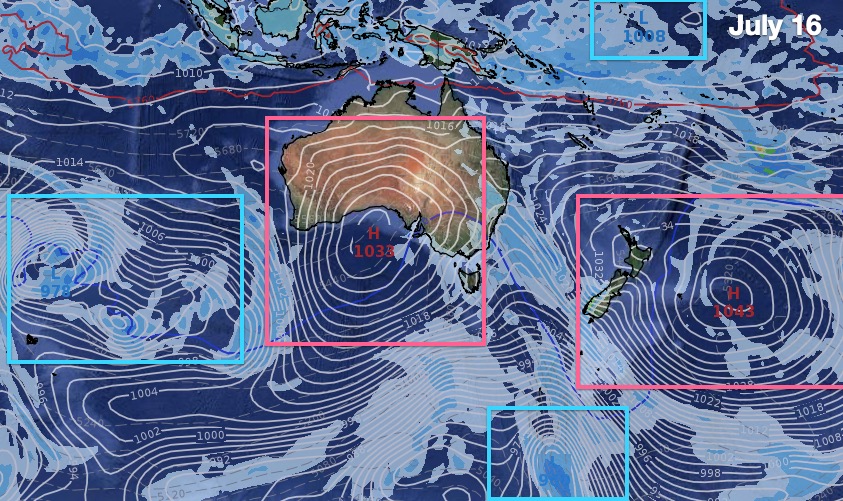
Basically the unsettled pattern that developed in June carries on into July – but by week 2 and 3 of July huge highs from Australia return and track across the country bringing extended dry spells – and, once again, limiting how much rain falls further north and east.
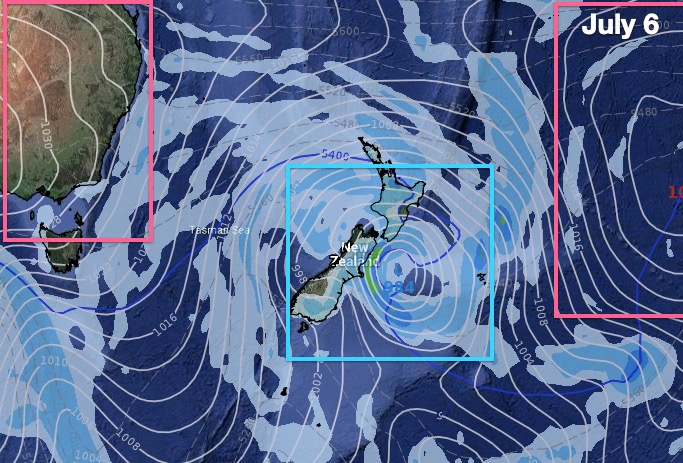
While the month kicks off with cold southerlies and wet weather in the east, the longer term trend is for westerlies to be more dominant, which favours drier weather in the east of both islands eventually.
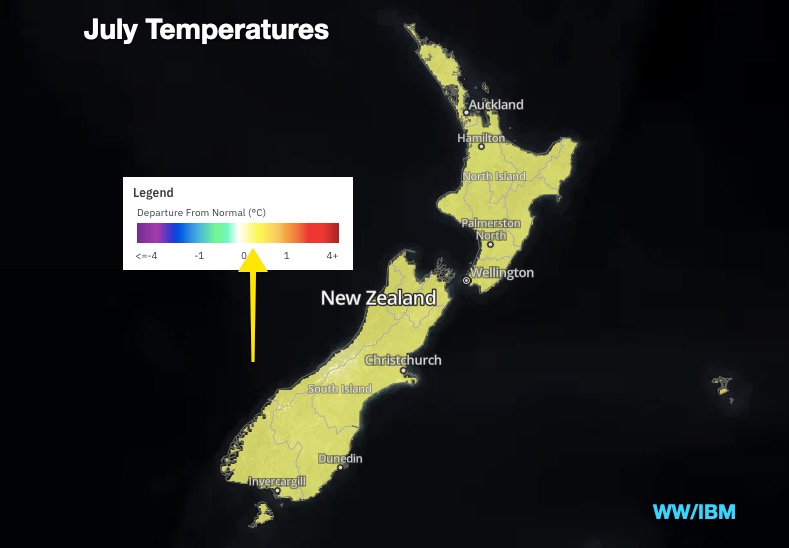
This airflow is also a fairly average one for temperatures, although July kicks off colder than average in many regions with July 1st an especially cold day for the South Island. However, these large highs and westerlies will help contribute fairly normal temperatures in the big scheme of things.
July should be about average temperature-wise (of course there will be some colder than normal days and milder than usual ones in the mix) but overall perhaps leans just very slightly above average nationwide.
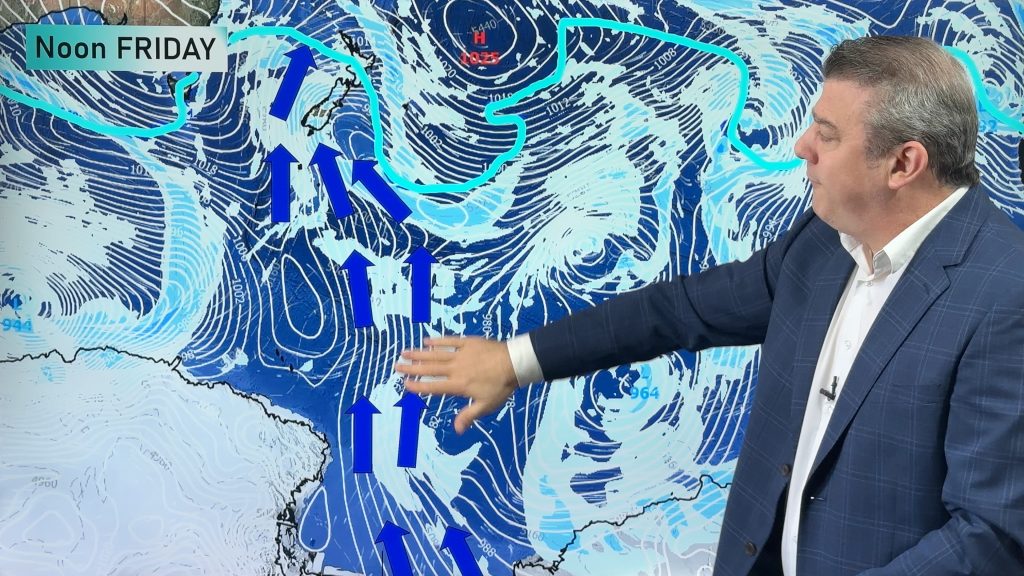
THE MAPS:

*Please note: Blue blocks indicate low pressure, red blocks indicate high pressure.

WHAT IBM SAYS FOR JULY
*Please note: IBM’s monthly data has about a 65% accuracy rate – the highest on the planet for long range forecasting, but it does highlight that there is some give and take to monthly forecasting. Refer to www.RuralWeather.co.nz for highly accurate local data for 10 days out).
SUMMARY:
Temperatures
- Overall a colder start to the month but perhaps a milder mid to end to the month. Temperatures therefore even out.
- Some good southerly changes brings more snow to the South Island ski fields – and high pressure brings clear skies, cold nights, ideal for snow making.
Rainfall:
- An increase in westerlies will see the eastern North Island dry out further but southerlies early in the month should bring normal rainfall to some parts of Canterbury.
- Wetter than average in Taranaki and parts of the West Coast and Southland.
- Auckland water storage dams get more downpours – but generally speaking July leans drier than normal for Auckland. (so plenty of showers but they may not accumulate to the normal July total).
Overall – a fairly positive weather forecast for the New Zealand economy.
Drill down further – with the largest local weather data website on earth for New Zealand! Visit www.RuralWeather.co.nz
Latest Video
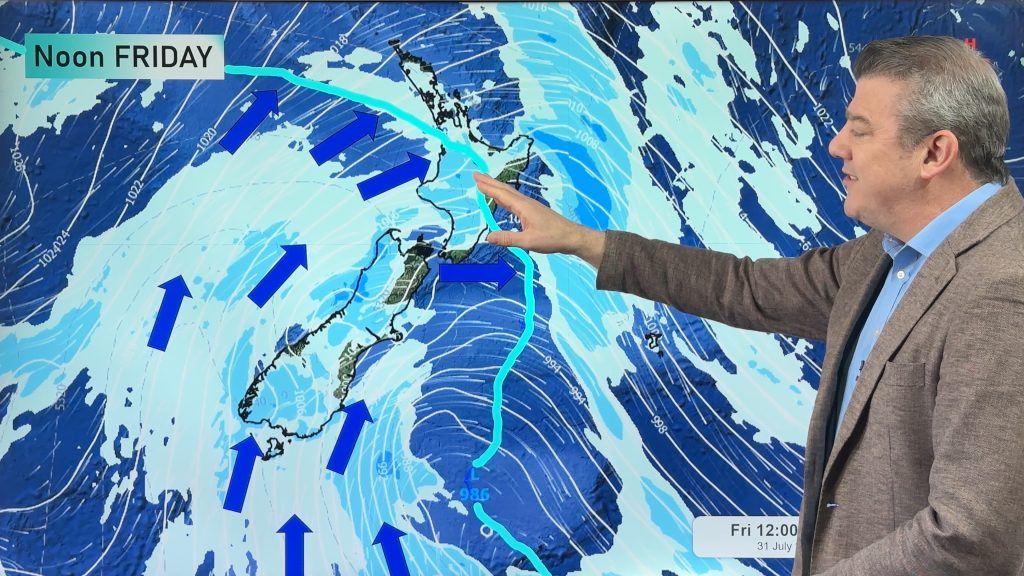
Antarctic southerly for parts of NZ Fri & Sat
For the first time this year a southerly from off Antarctica is heading towards the South Island, followed by more…
Related Articles
Antarctic southerly for parts of NZ Fri & Sat
For the first time this year a southerly from off Antarctica is heading towards the South Island, followed by more…

Meteors – Your Eyewitness Reports!
WeatherWatch.co.nz receives meteor reports from all over New Zealand and the globe, 24/7/365. **CASUAL COMMENTS**If you’ve seen something in the…
Snow, rain showers & cold polar southerlies set to return
Friday will be a wintry day across NZ as the next cold front arrives, bringing snow to lower levels of…

