ClimateWatch: SEPTEMBER outlook & how SPRING is shaping up (+16 Maps)
3/09/2022 8:01pm

> From the WeatherWatch archives
Published Wednesday — We’re seeing an uptick in high pressure across both NZ & Australia as we head into spring – but there are still rain and snowmakers in the mix too.
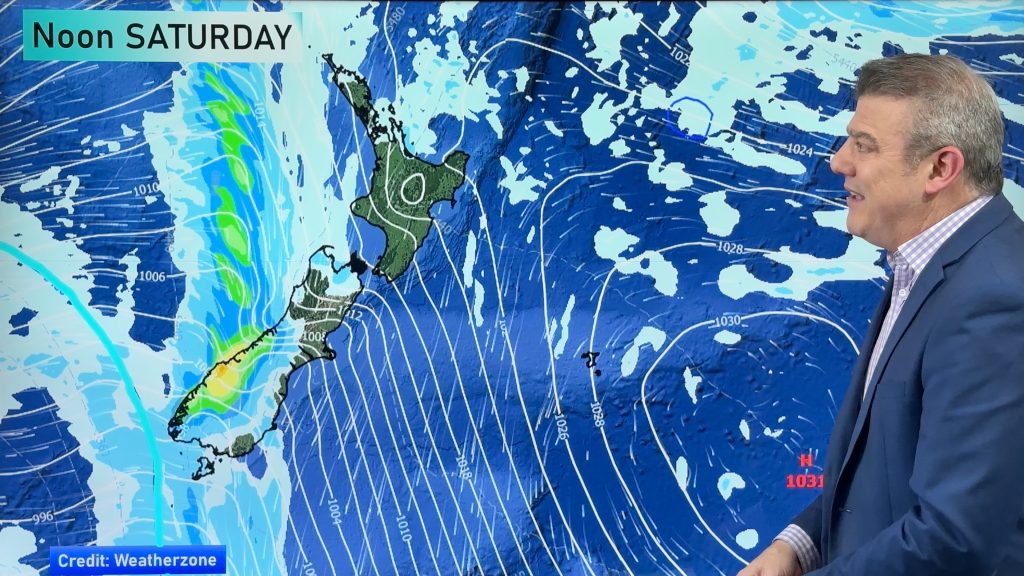
Generally speaking there is plenty of high pressure departing the Indian Ocean, tracking over southern Australia and then into New Zealand over the coming month(s).
There are rainmakers too, but for the first half of September they do appear quite broken up compared to the intensity of the lows and rainmakers we saw in August.
For New Zealand this means some much needed ‘breathing room’ following August’s record breaking rainfall, slips and flooding in a number of regions. We also see no immediate looming “atmospheric rivers’ driving down very wet tropical rain into NZ.
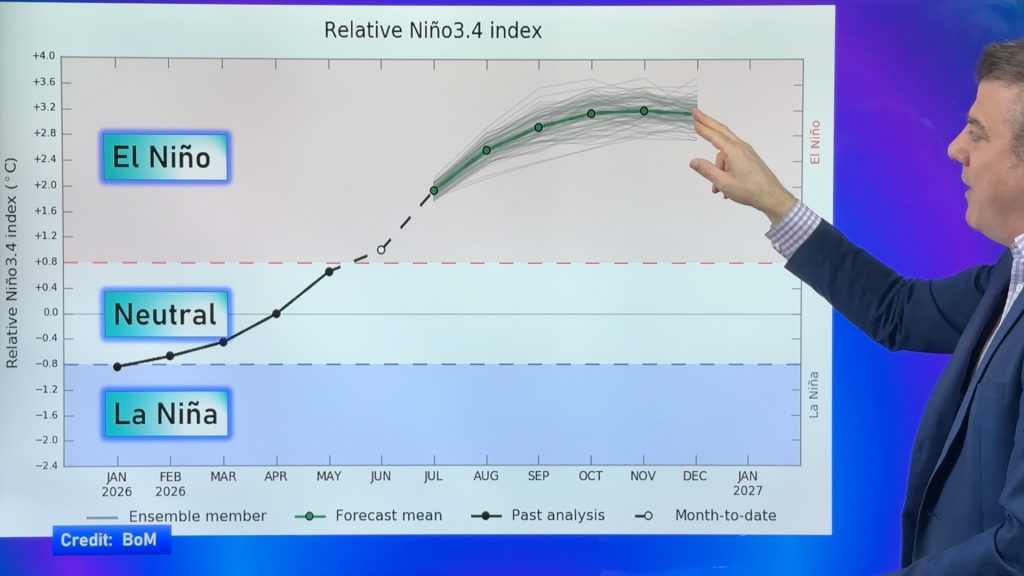
LA NINA
There is still chatter of La Nina reforming this spring for a third time – but modelling also suggests it may not be very powerful or long lasting if it does occur. Worthy of keeping a close eye on – but as we’ve seen with previous La Nina events there is still a lot of unknown science between La Nina forming and how it impacts NZ (due in part to our small size but also the fact we’re halfway from the equator to Antarctica…and La Nina is measured at the equator).


This modelling shows there is consensus for La Nina to officially come back again for a third time this spring — but that it may be mild and short lived, perhaps gone again by January 2023.
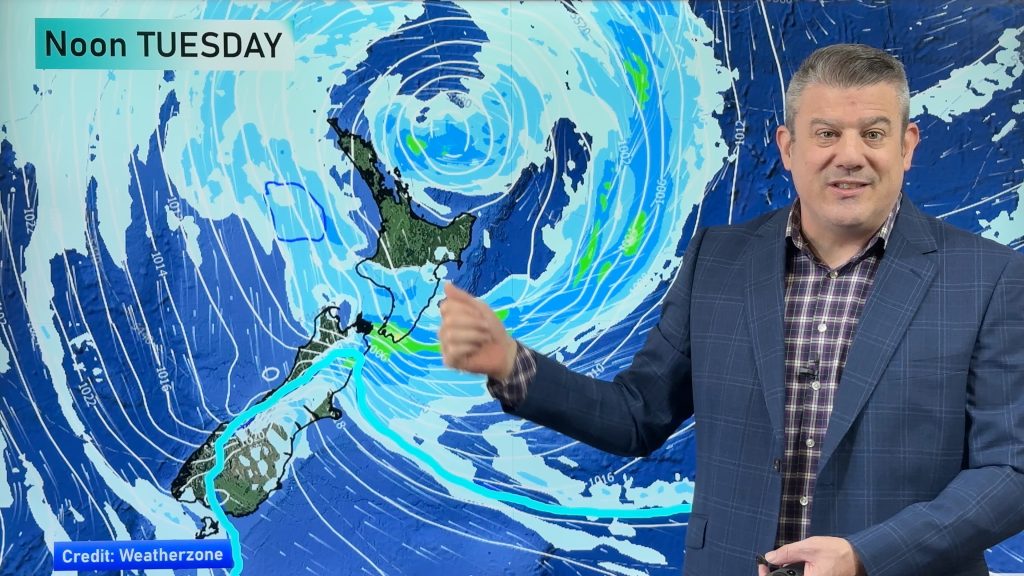
HOW SEPTEMBER IS SHAPING UP AIR PRESSURE-WISE:


RAINFALL:
New Zealand’s rainfall looks “closer to normal” this month (and for the season of Spring). We’re seeing a healthy mix of high pressure and low pressure and the spring pattern tends to drive in more westerlies, so rainfall is often higher along the western side of NZ than the eastern side. That’s certainly what we’re seeing in the NZ rainfall maps coming up.
Even the long range maps from IBM show NZ is “generally” in the normal range for rainfall. Some regions lean a little drier, others a little wetter – but at this stage no ‘atmospheric rivers’ are in the forecast to significantly alter expected rainfall totals beyond normal.


Remember to drill down deeper with rainfall totals at your place by visiting RuralWeather.co.nz – it will help bring these maps to life for you.


TEMPERATURES:
Once again NZ leans warmer than average nationwide, by half a degree to 1 full degree. This based on what has historically been recorded at this time of year over the last generation at least. Even with the wintry blast expected in some areas for the first week of September, we still expect all regions to end the month warmer than average overall.

SEA SURFACE TEMPERATURES:


These ClimateWatch updates are made independently by WeatherWatch.co.nz – in association with RuralWeather.co.nz and our official business partnership with IBM and *IBM Watson (*the world’s most accurate forecaster).
We use open public data to create a free public resource. Thank you to those outlets/Governments that support Open Data.
RuralWeather.co.nz / WeatherWatch.co.nz
Latest Video
Wintry weather coming: Snow, rain, wind & sunshine
A cold front is moving into NZ from Friday to Sunday with low pressure developing west of NZ and then…
Related Articles
Wintry weather coming: Snow, rain, wind & sunshine
A cold front is moving into NZ from Friday to Sunday with low pressure developing west of NZ and then…
ClimateWatch: JULY outlook & what El Niño means for NZ
El Niño is officially here and still getting stronger in the months ahead, but it’s harder to notice its effects…
Low pressure heading to NZ this weekend & into next week
Many regions have settled weather at the moment with frosts as far north as Auckland this morning, but still some…

