A month’s worth of rain possible in 7 days for some (not all) as big Tasman Sea low moves in (+10 Maps).
22/11/2020 9:10pm

> From the WeatherWatch archives
A low will rapidly form in the Tasman Sea across Tuesday, then will fall apart over Wednesday and Thursday as it crosses NZ.
It will dump some big rainfall totals through central New Zealand with 120mm+ possible in some places (potentially a months worth of rain in 7 days). These areas are likely through inland parts of the North Island, around inland Bay of Plenty, South Waikato, Taranaki and also around Nelson.
However not everyone will get big rainfall totals. Northland, Gisborne, Southland and Otago all have low numbers, as does the very eastern and southern parts of Canterbury.
Auckland, with water restrictions in force since May, is right on the boundary for heavier falls. Northern areas look drier, like eastern Northland. Those further towards Waikato have higher increased. Hopefully the Hunua Ranges will get over 40mm from this event.
From Waikato, including Bay of Plenty, right down to the upper South Island rain totals are much greater. This where the centre of the low will move in from Tuesday night to Thursday morning.
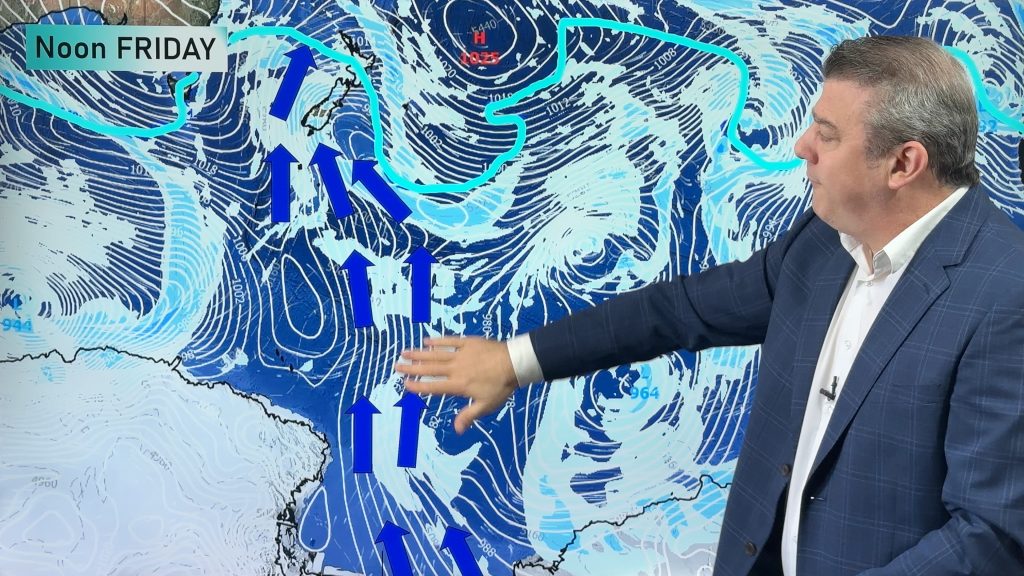
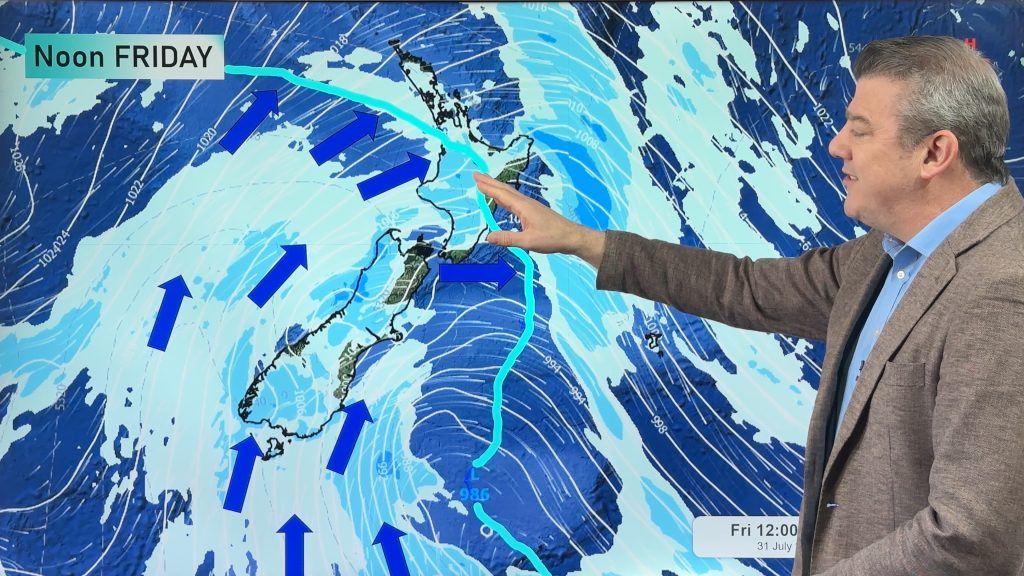
Winds will be blustery later on Tuesday from the north and will having varying directions as the low itself moves in. Gales are possible in Auckland from the north and west, while easterlies are likely to reach gale around Cook Strait (and maybe the lower North Island and upper South Island).
Generally speaking, due to the low weakening, winds shouldn’t be too much of a headache but some powercuts are possible due to the risk of tree branches breaking here and there.
Flooding is also possible in both islands.
You can view all tax funded MetService weather warnings and watches without leaving our website: www.weatherwatch.co.nz/maps-radars/warnings/metservice
You can view Rainfall Accumulation Maps (interactive) by going here: www.weatherwatch.co.nz/maps-radars/rain/accumulative-rainfall
You can view thunderstorm/lightning risk maps here (interactive): www.weatherwatch.co.nz/maps-radars/lightning/thunderstorm-risk


To drill down deeper locally, view your HOURLY forecasts at both WeatherWatch.co.nz and our free App (WeatherWatchNZ), or visit www.RuralWeather.co.nz (NZ’s largest weather data website).
Comments
Latest Video
Antarctic southerly for parts of NZ Fri & Sat
For the first time this year a southerly from off Antarctica is heading towards the South Island, followed by more…
Related Articles
Antarctic southerly for parts of NZ Fri & Sat
For the first time this year a southerly from off Antarctica is heading towards the South Island, followed by more…

Meteors – Your Eyewitness Reports!
WeatherWatch.co.nz receives meteor reports from all over New Zealand and the globe, 24/7/365. **CASUAL COMMENTS**If you’ve seen something in the…
Snow, rain showers & cold polar southerlies set to return
Friday will be a wintry day across NZ as the next cold front arrives, bringing snow to lower levels of…


josh on 23/11/2020 12:38am
Those rain maps looks good for auckland 🙂 its positive news.
WW Forecast Team on 23/11/2020 7:40pm
Here’s hoping!!
🙂
– WW