Latest various maps (+4) of Cyclone Pam’s expected track towards NZ
11/03/2015 9:11pm

> From the WeatherWatch archives
Computer models continue to pick a slightly eastern track for Cyclone Pam when it approaches us late on Sunday and early next week – however it is cetainly going to be a ‘very close call’ as it brushes our north east late Sunday and into Monday.
We will have a detailed video update on Friday afternoon with the latest for the weekend.
But for today we’re going to focus on the maps and tracks provided by various agencies around New Zealand and the world.
(Please note – the ‘Category 6’ indicated just south east of Vila is a typo by the Fiji Met Service. The scale only goes to 5)
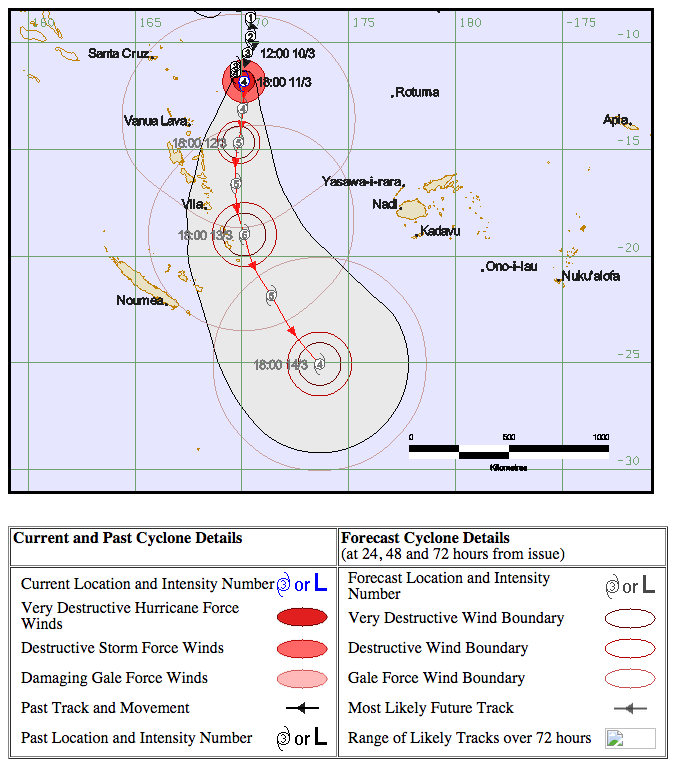

Above – FIJI MET SERVICE

ABOVE – JTWC (US Govt)

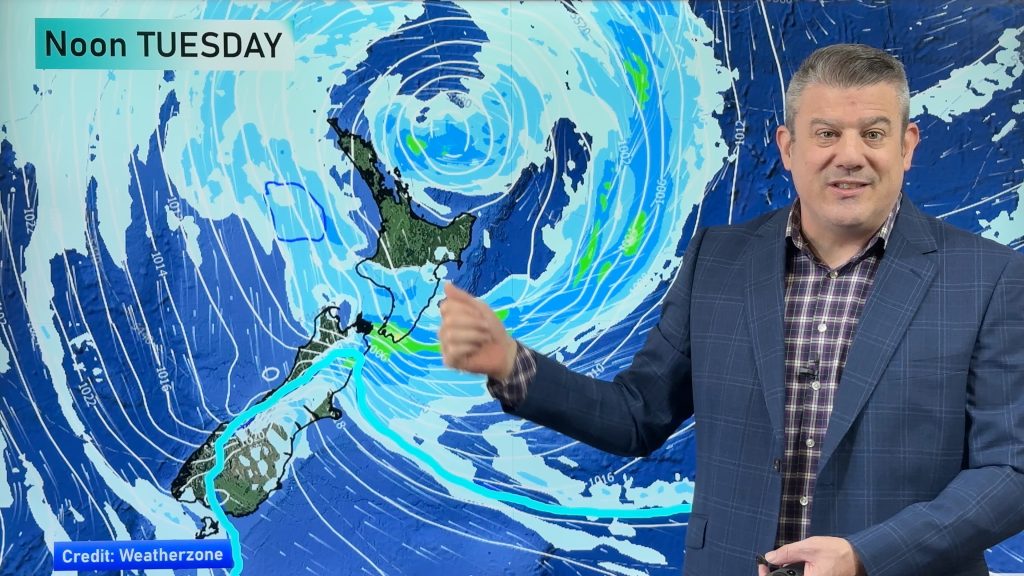
ABOVE – ECMWF wind map for Monday (Europe)
VIEW ALL OUR MAPS HERE – wind, swells, rain, sea temps, satellite: http://www.weatherwatch.co.nz/maps
Homepage image / The current wind map for Sunday morning / Weathermap
– WeatherWatch.co.nz
Comments
Latest Video
Wintry weather coming: Snow, rain, wind & sunshine
A cold front is moving into NZ from Friday to Sunday with low pressure developing west of NZ and then…
Related Articles
Polar airflow + northern low = pockets of heavy rain & snow
A colder change is coming – and so too is a large low which will develop and grow over northern…
Wintry weather coming: Snow, rain, wind & sunshine
A cold front is moving into NZ from Friday to Sunday with low pressure developing west of NZ and then…
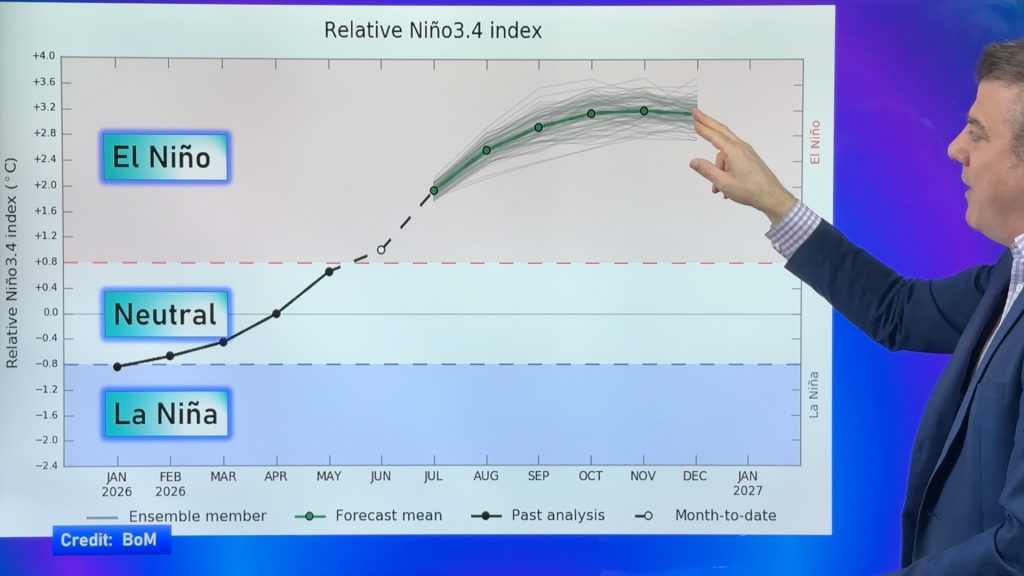
ClimateWatch: JULY outlook & what El Niño means for NZ
El Niño is officially here and still getting stronger in the months ahead, but it’s harder to notice its effects…


peter on 12/03/2015 3:21pm
The likely hood of that i think would be SLIM………. i exspect it to change course at the last minute…disasters do not happen in the same place TWICEfkthu
Andrew on 12/03/2015 2:46am
Hi Guys
I have noticed there is a inconsistency between the offshore swell charts and what is being forecast inshore, I know there is depletion of swell as it move in but there is a real gap. For example the eastern part of the BOP should recieve a direct north hit from the swell, which is showing to be around 20-25ft (big swell) yet inshore forecasts are only showing around 4-6ft, why is this? I get the feeling that inshore models are out of touch at the moment, one well known forecaster is claiming that this swell could be 15ft bigger and have a 5 second longer swell period, than Cyclone Ivy, which saw surfing in the Firth of Thames. The low will be super close to NZ so I imagine charts will jump at the last minute, can you explain the gap between the charts?
hitadmin on 12/03/2015 2:53am
Hi Andrew – we display the maps (untouched) directly from MetOcean/Weathermap – so you’re best to email them to ask that question. You can contact them directly via herw: http://www.metocean.co.nz/about/contact/
Cheers,
WW
Dave on 11/03/2015 10:00pm
There is still quite a lot of variation Phil, in real terms a couple of hundred miles seperation. That is quite a bit really in terms of likely wind speed.
It will be interesting to see the final outcome. Observation over quite a long period of time suggests to me that Weathermap will most likely get it right along with JTWC.
Timing looks later than originally predicted don’t you think? It is moving very slowly at present.
Cheers Dave
hitadmin on 12/03/2015 2:57am
Hi Dave – yes quite a bit of variation, so best thinking is usually to find the middle ground. Should zip past on Sunday night then slow down on Tuesday east of NZ… and the middle ground between all the likely models still has it just off our east coast (but certainly close enough to brush us with some severe weather in the north east, particularly Gisborne, eastern BOP and northern Hawkes Bay at this stage). Wind and rough seas look to be the main features for NZ at this stage.
Our weather video tomorrow will be more detailed about possible tracking and severe weather risks.
Cheers!
Phil
weatherman on 12/03/2015 9:36am
I could be wrong but has changed direction and is going to stick around for a bit. My computer tracking system has it there and it is getting stronger….