
> From the WeatherWatch archives
July 2017 was the planet’s second warmest July since record keeping began in 1880, said NOAA’s National Centers for Environmental Information (NCEI) on Thursday. NASA rated July 2017 as the warmest July on record, which means it was also tied for first place as Earth’s warmest month in recorded history (see Joe Romm’s report on this at climateprogress.org.) The only warmer July, according to NOAA, came during the strong El Niño of 2016. Minor differences can occur between the NASA and NOAA rankings because of their different techniques for analyzing data-sparse regions such as the Arctic.
Global ocean temperatures last month were the third warmest on record for any July, according to NOAA, and global land temperatures were the warmest on record. Global satellite-measured temperatures for the lowest 8 km of the atmosphere were the 4th warmest for any July in the 39-year record, according to the University of Alabama Huntsville (UAH) and Remote Sensing Systems (RSS).
 |
| Figure 1. Departure of temperature from average for July 2017, the second warmest July for the globe since record keeping began in 1880. Record warmth was present across the southern half of Africa, the Middle East, northern and central Australia, and across parts of China, Mongolia, and Madagascar. Across the oceans, record warmth was widespread across the western Indian Ocean and scattered across the western and central Pacific Ocean, northwestern Atlantic Ocean (off the U.S. eastern coast), and the Barents Sea. No land or ocean areas experienced record cold July temperatures. Image credit: National Centers for Environmental Information (NCEI). |
Second-warmest year on record thus far
Each of the first seven months of 2017 have ranked among the top three warmest such months on record, giving 2017 the second highest January–July temperature in the 138-year record: 0.90°C (1.62°F) above the 20th century average of 13.5°C (56.3°F). This is behind the record year of 2016 by 0.14°C (0.25°F). This near-record warmth is especially remarkable given the lack of an El Niño event this year. Global temperatures tend to be warmer during El Niño years, when the ocean releases more heat to the atmosphere. Given the lack of an El Niño event in 2017, it is unlikely that we will surpass 2016 as the warmest year on record.
Three billion-dollar weather disasters in July 2017
Three billion-dollar weathers disaster hit the Earth last month, according to the July 2017 Catastrophe Report from insurance broker Aon Benfield: A $3.4 billion flood in the Yangtze River valley of China, a $2.3 billion drought in Italy, and Tropical Storm Nanmadol in Japan, which did $1 billion in damage. In addition, damage claims from a late June severe weather outbreak in the U.S. ran up to $1.0 billion by the end of July. Through the end of July, Earth had sixteen billion-dollar weather events for the year, which is a typical number for this point in the year. The year that ended with the most billion-dollar weather disasters in records going back to 1990 was 2013, with 41; that year had 22 billion-dollar disasters by the end of July. Last year, there were already 25 billion-dollar weather disasters by the end of July; that year ended up with 31 such disasters. Here are this year’s billion-dollar weather disasters through the end of July:
Flooding, China, 6/22 – 7/5, $6.4 billion, 141 killed
Flooding, China, 7/13 – 7/17, $3.4 billion, 20 killed
Flooding, Peru, 1/1 – 4/1, $3.1 billion, 120 killed
Severe Weather, Rockies, Plains, U.S., 5/8 – 5/11, $2.6 billion, 0 killed
Tropical Cyclone Debbie, Australia, 3/27 – 4/5, $2.4 billion, 14 killed
Drought, Italy, 1/1 – 7/31, $2.3 billion, 0 killed
Severe Weather, Plains, Southeast, Midwest U.S., 3/26 – 3/28, $2.2 billion, 0 killed
Severe Weather, Midwest, Plains, Southeast U.S., 3/6 – 3/10, $2.1 billion, 0 killed
Severe Weather, Midwest, Plains, Southeast MS Valley U.S., 4/28 – 5/01, $2.0 billion, 20 killed
Drought, Somalia, Ethiopia, Kenya, 1/1 – 3/31, $1.9 billion, hundreds killed
Severe Weather, South U.S., 2/27 – 3/2, $1.9 billion, 4 killed
Severe Weather, Midwest U.S., 6/11, $1.4 billion, 0 killed
Severe Weather, South U.S., 1/18 – 1/23, $1.3 billion, 21 killed
Tropical Storm Nanmadol, Japan, 7/4 – 7/6, $1.0 billion, 37 killed
Severe Weather, Plains, Midwest, Northeast U.S., 6/27 – 6/30, $1.0 billion, 0 killed
Winter Weather, Plains, Midwest, Southeast, Northeast U.S., 3/13 – 3/15, $1.0 billion, 11 killed
 |
| July Billion-Dollar Disaster 1. Exceptional drought has affected vast swaths of Italy, particularly the southern half, through the first half of 2017, resulting in $2.3 billion in agricultural losses. In this image, we see pedestrians fill their bottles with water from a ‘Nasone’ (Big nose) typical Roman fountain in front of The Pantheon in central Rome on July 28, 2017. Two years of lower-than-average rainfall in Rome has forced Rome to close fountains and consider the prospect of water rationing. Image credit: ANDREAS SOLARO/AFP/Getty Images. |
 |
| July Billion-Dollar Disaster 2. Flooding in nine southern Chinese provinces from July 13 – 17, caused by thunderstorms associated with seasonal Mei-yu rains, killed 20 and damaged or destroyed more than 58,000 homes, causing $3.4 billion in damage. Above: A woman tries to cross a flooded street after a heavy rain in Shenyang, Liaoning province on July 14, 2017. Image credit: FRED DUFOUR/AFP/Getty Images. |
 |
| July Billion-Dollar Disaster 3. Heavy flooding occurred in Japan following the landfall of Tropical Storm Nanmadol, augmented by a lingering frontal boundary that spawned prolific rainfall. More than 2,600 homes and other structures were damaged or destroyed as extensive flooding and landslides affected Fukuoka, Oita, Shimane, Kumamoto, and Hiroshima prefectures. Total economic losses were expected to near $1 billion. In this image, we see workers remove a section of roof from the roadside, blown over by strong winds generated by Nanmadol in the city of Kumamoto on Kyushu island on July 4, 2017. Image credit: STR/AFP/Getty Images. |
 |
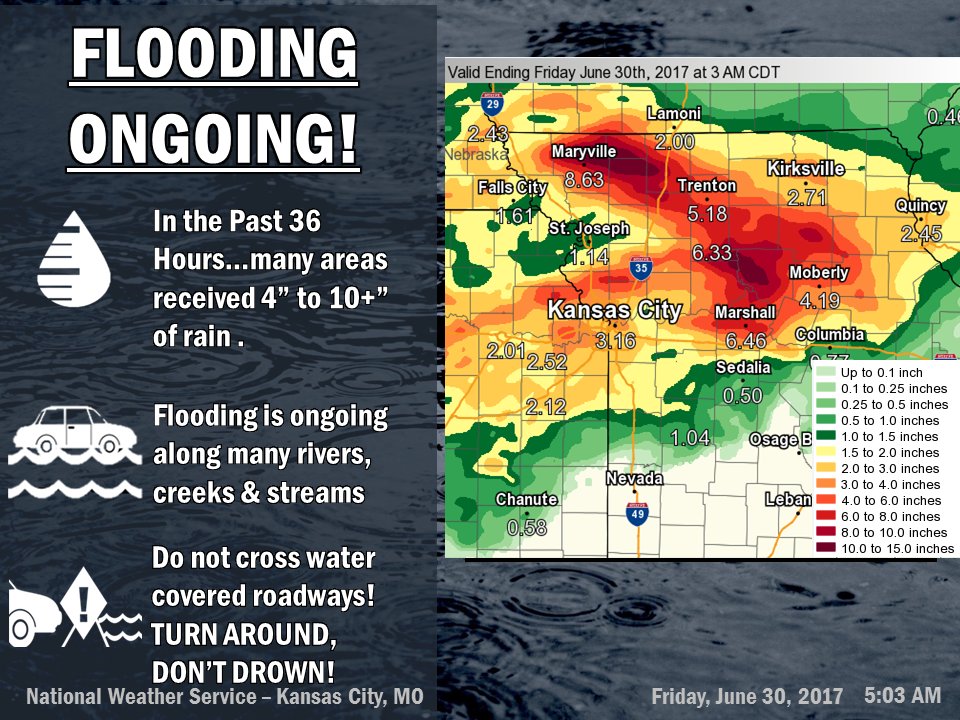
| Extra June Billion-Dollar Disaster 1. Severe thunderstorms swept across multiple sections of the United States from June 25-29, causing widespread damage resulting from tornadoes, straight-line winds, large hail and flooding rainfall. The worst impacts occurred from June 27-30 as a slow-moving storm system led to consecutive days of convective weather across the Plains and Midwest. Total damage had accumulated to $1 billion by the end of July. Above: tweet from the NWS in Kansas City on the late June flooding in their region. |
No El Niño or La Niña conditions expected into winter
In its August 10 monthly advisory, NOAA’s Climate Prediction Center (CPC) stated that neither El Niño nor La Niña conditions were present in the Eastern Pacific (ENSO-neutral conditions existed), and these neutral conditions were expected to persist into September (85% chance.) Sea surface temperatures (SSTs) in the benchmark Niño 3.4 region (in the equatorial Pacific) were about 0.2°C below average over the past week; SSTs of 0.5°C or more above average in this region are required to be classified as weak El Niño conditions, with the 3-month average SSTs holding at these levels for five consecutive months (with an accompanying El Niño-like atmospheric response). A surge of enhanced east-to-west blowing trade winds is predicted for the west-central Pacific over the next two weeks, and these stronger-than-average trade winds will interfere with any progression towards El Niño.
NOAA forecasters gave a 15 – 20% chance of an El Niño event by winter—a major downgrade from their previous month’s forecast, which gave a 35 – 45% chance. El Niño conditions tend to suppress Atlantic hurricane activity by bringing strong upper-level winds to the tropical Atlantic, creating high wind shear that tears storms apart. A reduction in the odds of El Niño boosts the odds of an active Atlantic hurricane season.
 |
| Figure 2. Sea surface temperatures (SSTs) in the benchmark Niño 3.4 region (in the equatorial Pacific) were hovering at about 0.5°C above average for most of June, right at the 0.5°C above average threshold for weak El Niño conditions. However, in July, these temperatures cooled considerably, making an El Niño event less likely this year. Image credit: Levi Cowan, tropicaltidbits.com. |
Arctic sea ice extent the fifth lowest on record for July
Arctic sea ice extent during July 2017 was the fifth lowest in the 38-year satellite record, according to the National Snow and Ice Data Center (NSIDC). The Arctic was dominated by a broad area of low pressure, which brought cloudy skies and slower ice loss than we saw in the record-low extent years of 2012 and 2007. The GFS model is predicting that low pressure and cloudy skies will continue to predominate in the Arctic over the coming two weeks, which should keep 2017 from breaking the record for lowest ice extent.
Antarctic sea ice extent the lowest on record for July
Sea ice surrounding Antarctica has been at unprecedented lows in recent months, setting an all-time monthly minimum extent record each month during the five-month period November 2016 – March 2017, and again in July of 2017. Monthly Antarctic sea ice extent in April, May and June of 2017 were the second lowest on record for their respective months. A recent study by John Turner and colleagues links the recent Antarctic sea ice decline to a series of strong storms accompanied by long periods of warm winds from the north. These changing weather conditions are associated with large shifts in the Southern Annual Mode (SAM) index.
Notable global heat and cold marks set for July 2017
Hottest temperature in the Northern Hemisphere: 53.0°C (127.4°F) at Basra Airport, Iraq, 11 July
Coldest temperature in the Northern Hemisphere: -33.0°C (-27.4°F) at Summit, Greenland, 4 July
Hottest temperature in the Southern Hemisphere: 37.4°C (99.3°F) at Itaituba, Brazil, 17 July
Coldest temperature in the Southern Hemisphere: -81.5°C (-114.7°F) at Dome A, Antarctica, 11 July
(Courtesy of Maximiliano Herrera.)
Major weather stations that set (not tied) new all-time heat or cold records in July 2017
So far in 2017, 161 major weather stations have set records for the all-time highest temperature ever measured, and 17 have set records for the all-time lowest temperature ever measured. Here are the records for July 2017:
Antalya Observatory (Turkey) max. 45.4°C, 1 July
Aydin (Turkey) max. 44.8°C, 2 July
Bodrum (Turkey) max. 46.8°C, 2 July
Young (Australia) min. -7.0°C, 2 July
West Wyalong (Australia) min. -5.6°C, 2 July
Cootamundra (Australia) min. -7.8°C, 2 July
Bairnsdale (Australia) min. -5.4°C, 2 July
East Sale (Australia) min. -7.0°C, 3 July
Kanggye (North Korea) max. 38.0°C, 6 July
Huichon (North Korea) max. 37.5°C, 6 July
Udskoe (Russia) max. 39.0°C, 6 July
Kur (Russia) max. 37.5°C, 6 July
Burukan (Russia) max. 38.7°C, 7 July
Vesalaja Gorka (Russia) max. 39.6°C, 7 July
IM Poliny Osipenko (Russia) max. 39.3°C, 7 July
Gorin (Russia) max. 38.7°C, 7 July
Abu Dhabi Int. Airport (United Arab Emirates) max. 49.3°C, 7 July
Giles M.O. (Australia) min. -2.5°C, 8 July
Hafr Al Batin (Saudi Arabia) max. 49.7°C, 8 July
Learmonth (Australia) min. 3.5°C, 10 July
Turpan (China) max. 49°C, 10 July
Tikanlik (China) max. 43.9°C, 10 July
Ya’An (China) max. 38.6°C, 10 July
Erbaoxiang (China) max. 50.5°C, 10 July: New national record high for China (for inhabited places)
Zhongning (China) max. 40.1°C, 11 July
Yanchi (China) max. 38.7°C, 11 July
Abadan (Iran) max. 52.3°C, 11 July
Otog Qi (China) max. 39.1°C, 12 July
Fez Airport (Morocco) max. 46.4°C, 12 July
Syracuse (Italy) max. 45.4°C, 12 July
Granada Airport (Spain) max. 45.7°C, 12 July
Cordoba Airport (Spain) max. 46.9°C, 13 July
Badajoz Airport (Spain) max. 45.4°C, 13 July
Montoro AEMET (Spain) max. 47.3°C, 13 July: New national record high for Spain (official)
Taza (Morocco) max. 46.3°C, 14 July
Bariloche (Argentina) min. -25.4°C, 16 July
Cordoba Airport (Argentina) min. -8.3°C, 17 July
Chamical Airport (Argentina) min. -8.3°C, 17 July
Lindong (China) max. 40.8°C, 17 July
Errachidia (Morocco) max. 43.7°C, 28 July
Notes: On 4 July, Summit (Greenland) recorded -33.0°C, which is the lowest temperature ever recorded in July in the Northern Hemisphere.
(Courtesy of Maximiliano Herrera.)
One all-time national heat record set in July 2017
As noted above, one nation (Spain) set an all-time record for hottest temperature in recorded history in July 2017. In addition, China set a record for the hottest temperature ever recorded in an inhabited place.
As of August 20, ten nations have set or tied all-time national heat records in 2017, and two have set or tied all-time cold records. National all-time monthly temperature records so far in 2017 have numbered 35 for maximum temperature, and 2 for minimum temperature. Most nations do not maintain official databases of extreme temperature records, so the national temperature records reported here are in many cases not official. I use as my source for international weather records researcher Maximiliano Herrera, one of the world’s top climatologists, who maintains a comprehensive list of extreme temperature records for every nation in the world on his website. If you reproduce this list of extremes, please cite Maximiliano Herrera as the primary source of the weather records.
All-time national heat records set or tied in 2017:
San Marino: 104.5°F (40.3°C), at Serravalle, 3 and 9 August
Spain: 117.1°F (47.3°C), at Montoro AEMET, 12 July
United Arab Emirates: 125.2°F (51.8°C), at Mezaira, 30 June
Iran: 128.7°F (53.7°C), at Ahwaz, 29 June
Oman: 123.4°F (50.8°C), at Qurayyat on 30 May and at Joba on 31 May (tie)
Pakistan: 128.3°F (53.5°C), at Turbat on 28 May (tie)
Guinea: 113°F (45.0°C), at Koundara, 29 March (tie)
Ghana: 110.8°F (43.8°C), at Navrongo, 26 March
Cocos Islands (Australia): 91.0°F (32.8°C), at Cocos Island Airport, 23 February (tie with 8 April 2015 and 11 April 1998)
Chile: 113°F (45.0°C), at Cauquenes, 26 January
All-time national cold records set in 2017:
Qatar: 34.7°F (1.5°C) at Abu Samra, 5 February
United Arab Emirates: 22.3°F (-5.4°C) at Jabel Jais, 3 February
– By Dr Jeff Masters, Wunderground/IBM
Comments
Latest Video
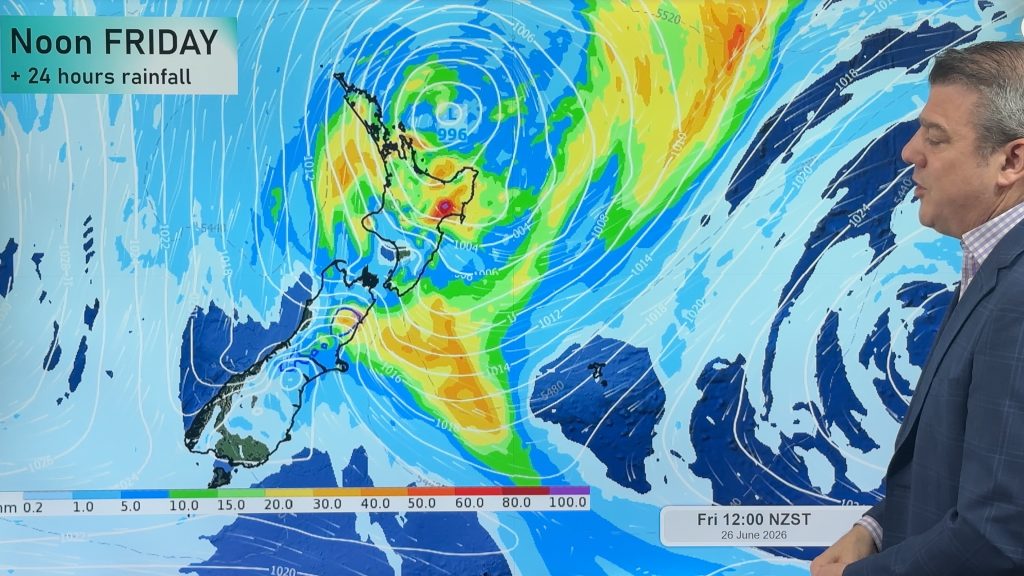
Slow go for northern low & southern cold
For the next few days low pressure will crawl over the upper North Island, driving in rain as far south…
Related Articles
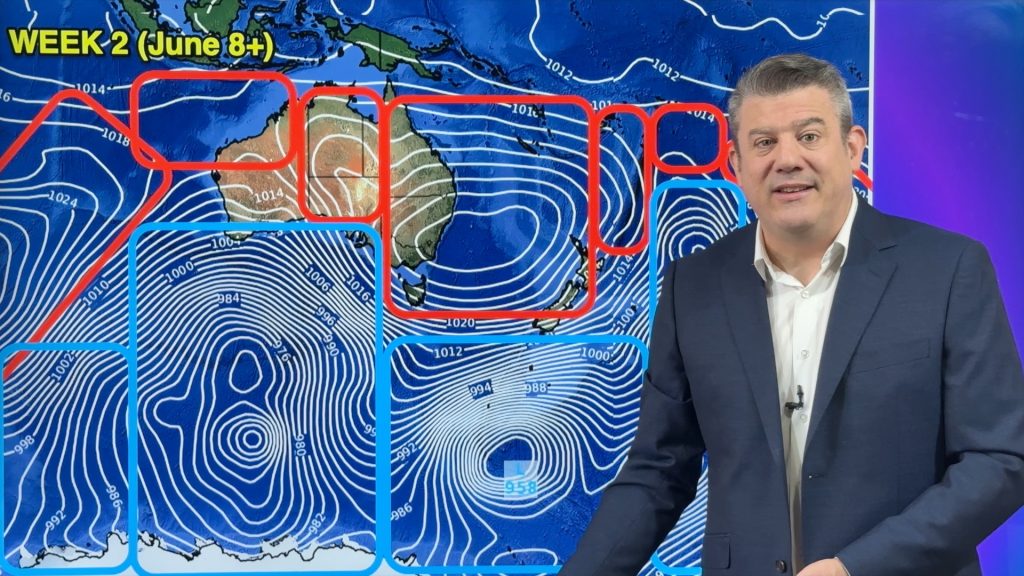
ClimateWatch: JUNE outlook as El Niño continues to build
June has kicked off in NEUTRAL again as far as El Niño is concerned, but it is expected to form…
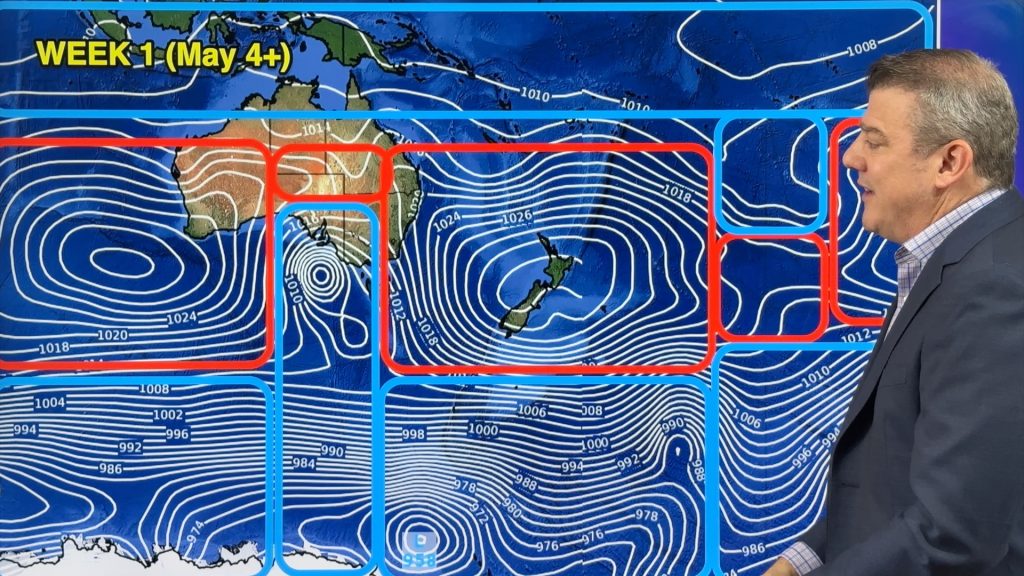
ClimateWatch: May outlook & El Niño discussion
Everyone is talking about El Niño so in this month’s update we discuss when it may be forming and what…
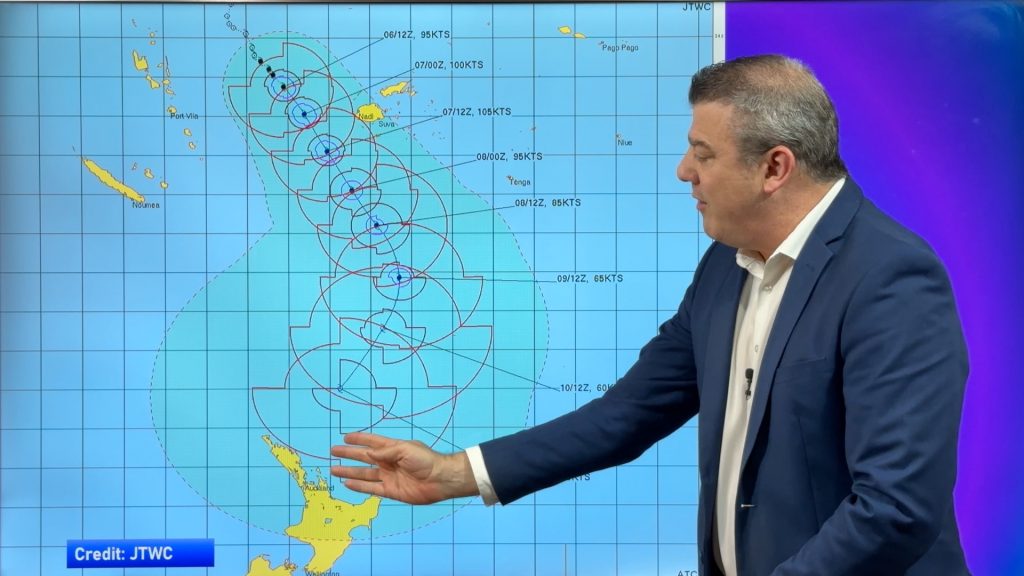
Tropical Cyclone VAIANU: Fiji then NZ
*Published Tuesday AM* Fiji is being affected today by offshore Severe Tropical Cyclone Vaianu and NZ has the chance of…


Guest on 22/08/2017 7:18pm
Things look a bit different on this report;
https://www.newswise.com/articles/global-temperature-report-july-2017