
> From the WeatherWatch archives
The current strong El Niño will weaken into the spring, but its impacts will persist through the winter, according to the latest monthly outlook issued Thursday by NOAA.
Sea-surface water temperatures (SST) in the equatorial central and eastern Pacific Ocean appeared to reach their peak in mid-November and are now slowly cooling, according to fine-resolution weekly SST data from NOAA’s Climate Prediction Center.

Averaged over the latest three-month period from October through December 2015, SSTs in this zone were 2.3 degrees Celsius above average, according to NOAA/CPC. That departure from average tied the peak anomaly measured during the 1997-98 El Niño, the strongest El Niño on record since recordkeeping began in 1950.
El Niño is an anomalous, yet periodic, warming of the central and eastern equatorial Pacific Ocean. For reasons still not well understood, every two to seven years, this patch of ocean warms for 9 to 18 months, then cools.
Citing the latest model guidance, NOAA/CPC said Thursday El Niño, as it typically does, will weaken through the spring, eventually disappearing by late spring or early summer. This means sea-surface water temperatures in the equatorial central and eastern Pacific Ocean will return to near-average levels from their current above-average state.
However, the El Niño will remain strong through the winter before finally easing up and transitioning to neutral conditions by late spring or early summer.
Even if this El Niño begins to ease, peak impacts on U.S. weather typically occur in winter, and we will likely continue to see impacts around the world. A record active central Pacific hurricane season and dry conditions leading to devastating wildfires in Indonesia are among the impacts we’ve seen so far.
Potential Winter/Spring Weather Impacts
Animation of one-month precipitation anomalies, in inches, from February through May during the five previous strong El Niños (1998, 1983, 1973, 1966, 1958) dating to 1950. Wetter (drier) than-average areas shaded in teal/blue (yellow/orange/red). (NOAA/ESRL PSD and CIRES-CU)
Animation of one-month temperature anomalies, in degrees Fahrenheit, from February through May during the five previous strong El Niños (1998, 1983, 1973, 1966, 1958) dating to 1950. Colder (warmer) than average areas shaded in green/blue (yellow/orange/red). (NOAA/ESRL PSD and CIRES-CU)
Precipitation and temperature impacts in the U.S. from a strong El Niño are typically most noticeable during the colder months, from late fall through winter, a bit less so in the spring.
(MORE: January Through March Outlook)
It’s also important to keep in mind:
1) El Niño is not the sole driver of the atmosphere at any time. Day-to-day variability in the weather pattern, including blocking patterns, forcing from climate change and other factors all work together with El Niño to determine the overall weather experienced over the timeframe of a few months.
2) No two El Niños are exactly alike.
Looking at past strong El Niños, as classified by consultant meteorologist Jan Null, here are the most consistent signals we’ve seen in the data for temperatures and precipitation from February through May in the U.S.:
– Wetter: California, most of the Great Basin and Desert Southwest; Lower Mississippi Valley, Southeast and most of the East Coast
– Drier: From western Washington into the Northern Rockies and Northern Plains
– Cooler: Much of the southern half of the nation, from California to the Carolinas
– Warmer: Northern tier of states from the Pacific Northwest to the Northern Plains, northern Great Lakes, and northern New England.
While it’s well known strong El Niño winters can be wet in California and the Southeast, it’s interesting to note how wet past springs have been even as the El Niño weakens.
A rather large swath of the South, Ohio Valley and Northeast has been wetter than average in April. In the Tennessee Valley, that wetness has tended to lag into May, as well.
Four out of the five February through May periods during or after strong El Niños have been wetter than average in the Northeast I-95 corridor.
Temperature-wise, the general warmer-than-average North/cooler-than-average South scenario tended to break down somewhat by April.
In fact, post-strong El Niño Aprils of the past were downright cold in parts of the Plains and Rockies. Stubbornly cool conditions lagged into May in the Great Lakes, Ohio Valley and Northeast.
With investments, past performance doesn’t guarantee future results. So, while these impacts have tended to occur in the winters and springs of strong El Niños, factors such as day-to-day variability, blocking of the jet stream, even climate change will also play a role in your overall weather into spring 2016.
– Weather.com
Comments
Latest Video
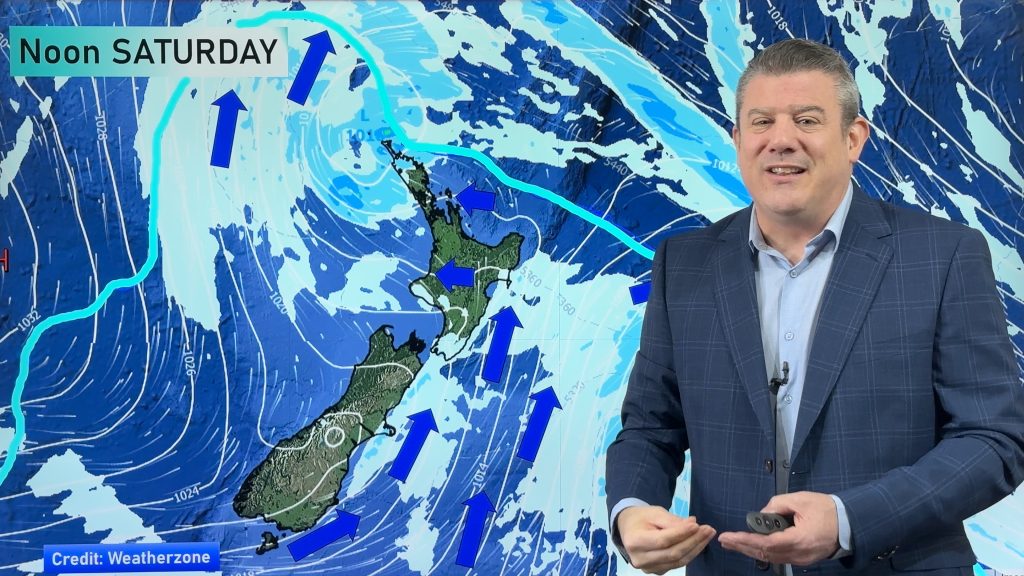
Cold weekend, frosts return with high pressure, then a low late next week
The subantarctic airflow spreads over NZ today/tonight and into Saturday, dropping temperatures nationwide. Snow flurries are possible today to lower…
Related Articles

Meteors – Your Eyewitness Reports!
WeatherWatch.co.nz receives meteor reports from all over New Zealand and the globe, 24/7/365. **CASUAL COMMENTS**If you’ve seen something in the…
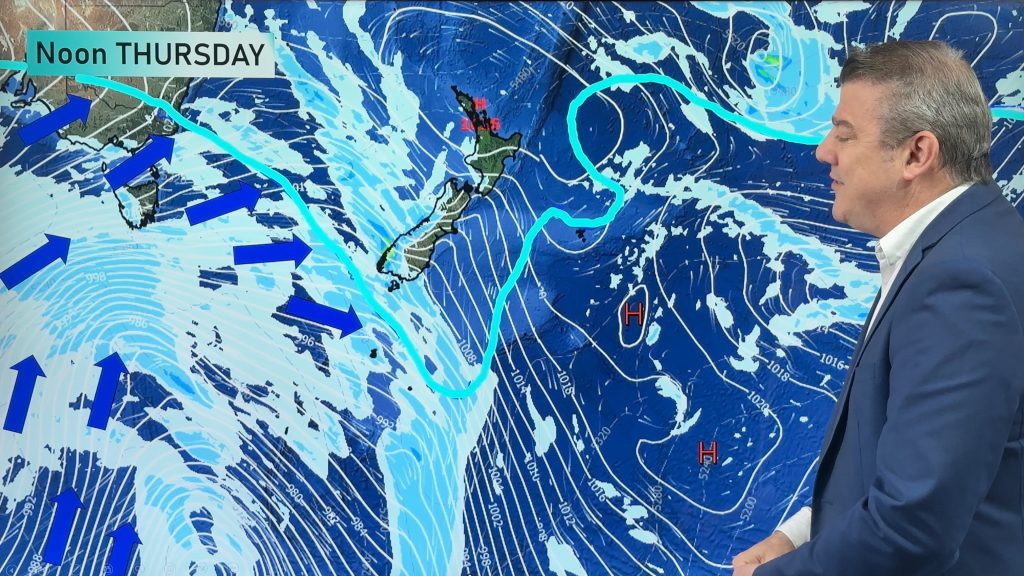
Wintry blast coming this weekend, everyone will feel the temperature drop
A significant cold change is coming in this weekend, starting as early as Friday for the lower South Island and…
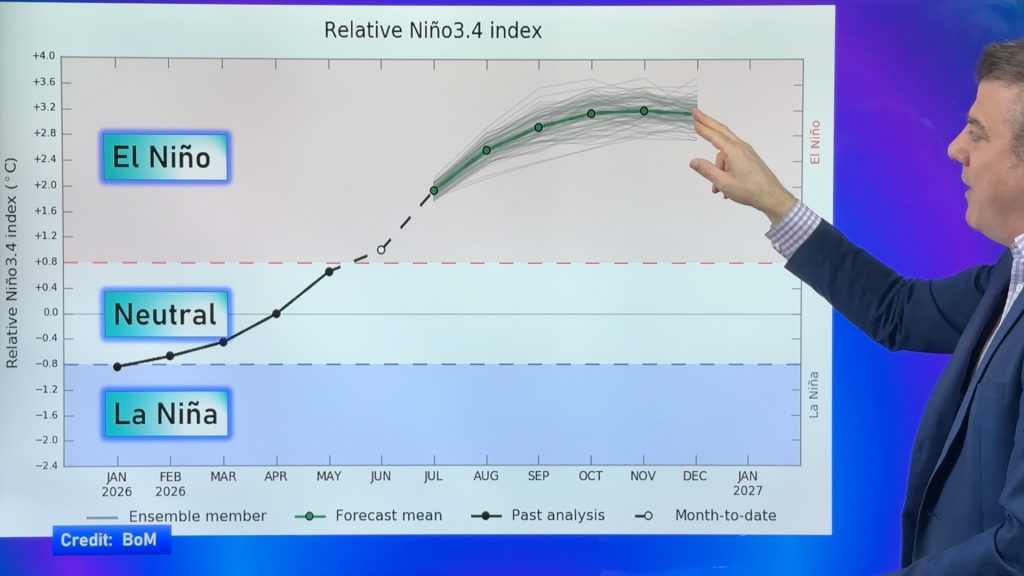
ClimateWatch: JULY outlook & what El Niño means for NZ
El Niño is officially here and still getting stronger in the months ahead, but it’s harder to notice its effects…


bp on 17/01/2016 2:53pm
Considering they have only been tracking el nino for a few decades I’m not terribly impressed …weather people have a tendency to say it’s the hottest, coldest, wettest, driest EVER which is obviously false. The headlines say strongest “ever” Weather is weather..we’re always breaking or setting records. Not hard to do when you’ve only been keeping track for a tiny fraction of time.