NASA: Hottest June on record continues 14-month global heat wave, NZ mentioned (+Video)
20/07/2016 2:58am

> From the WeatherWatch archives
The first six months of 2016 were the hottest ever recorded, NASA announced today, while Arctic sea ice now covers 40% less of the Earth than it did just 30 years ago.

The increase in carbon dioxide has come party from burning fossil fuels, and has surpassed historic highs in the past decades according to NASA.
Comments
Latest Video
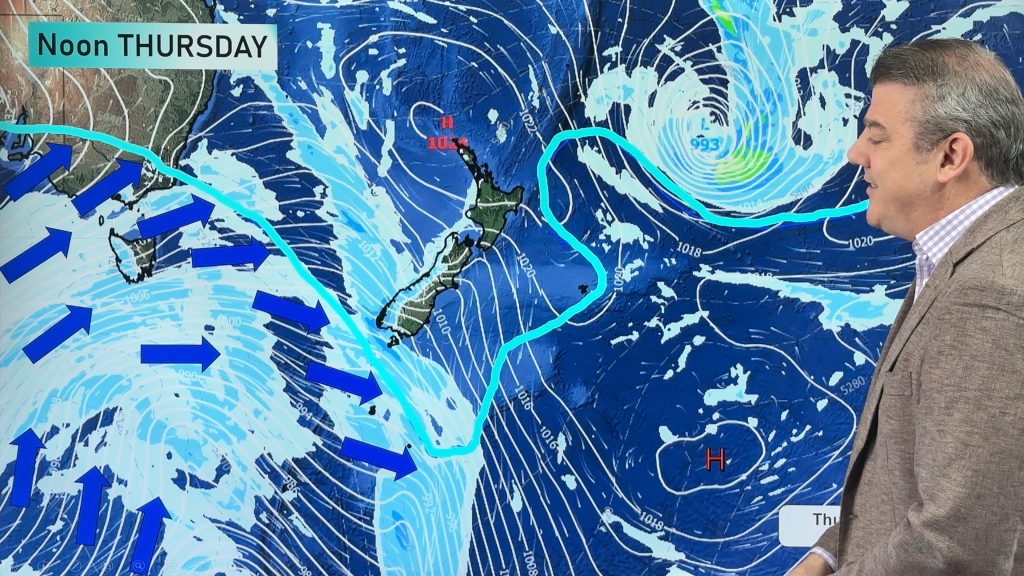
Polar airflows set to bring cold weekend to NZ
Nor-west winds will be building over parts of NZ going into Thursday with rain on the West Coast becoming heavy…
Related Articles
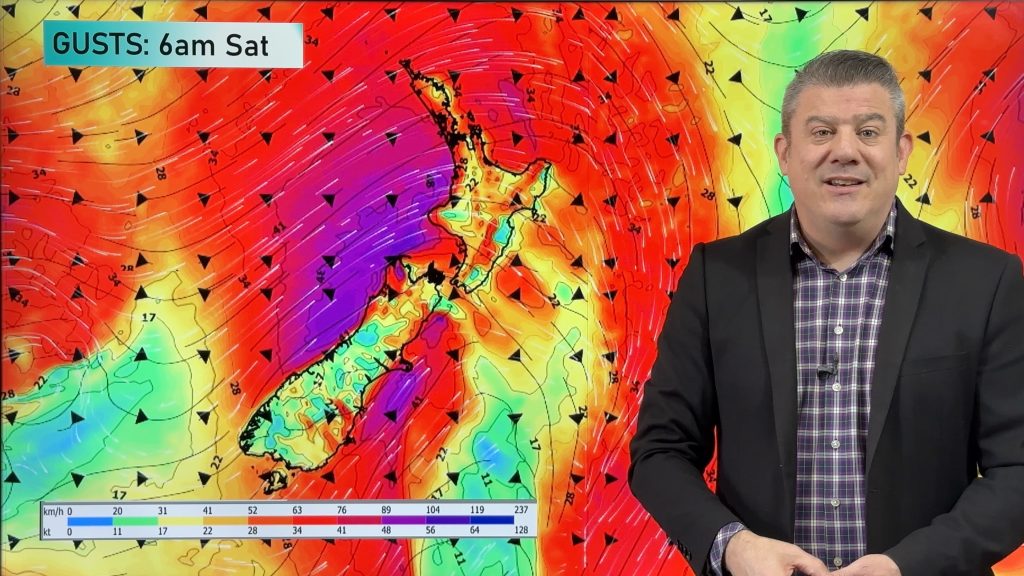
Wind, rain, showers & a noticeable temperature drop for all
It will be a colder weekend right across NZ as a sub-Antarctic southerly blows through, bringing frosts, snow flurries and…
Polar airflows set to bring cold weekend to NZ
Nor-west winds will be building over parts of NZ going into Thursday with rain on the West Coast becoming heavy…
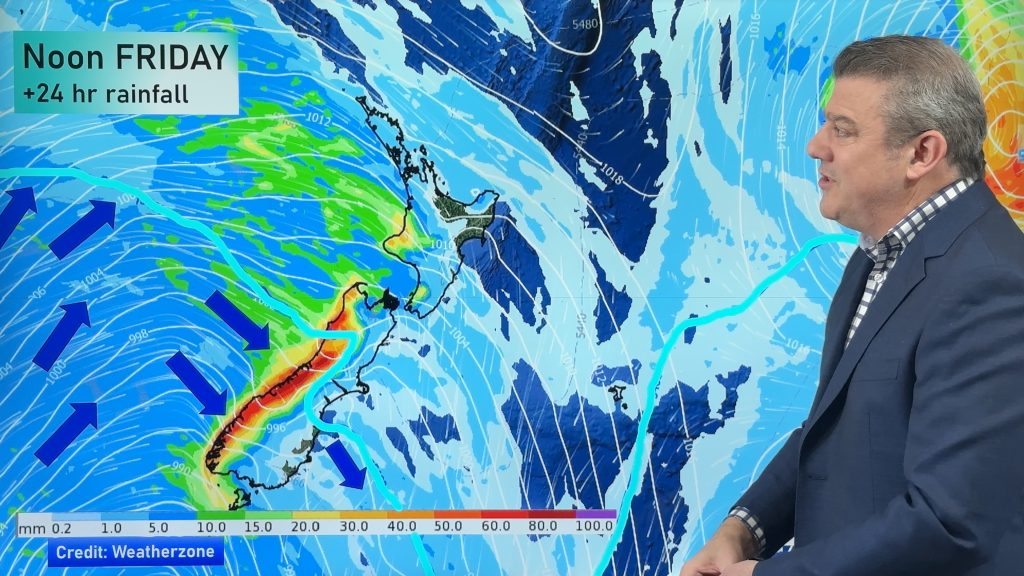
Update on incoming cold change for NZ
High pressure still covers NZ but that will slide offshore as we go into Friday and the weekend as a…


John on 20/07/2016 9:47pm
And we can trust NASA/NOAA, yeah right.
Evaluating The Integrity Of Official Climate Records http://realclimatescience.com/wp-content/uploads/2016/07/Evaluating-The-Integrity-Of-Official-Climate-Records-4.pdf NASA has repeatedly altered their own data, making pre-1980 temperatures cooler doubling 1880-1980 warming by altering data.
https://bobtisdale.wordpress.com/2015/06/04/noaancdcs-new-pause-buster-paper-a-laughable-attempt-to-create-warming-by-adjusting-past-data/ Comments from Georgia Tech Climatologist Dr. Judith Curry. The greatest changes in the new NOAA surface temperature analysis is to the ocean temperatures since 1998. This seems rather ironic, since this is the period where there is the greatest coverage of data with the highest quality of measurements – ARGO buoys and satellites don’t show a warming trend. Nevertheless, the NOAA team finds a substantial increase in the ocean surface temperature anomaly trend since 1998…The global surface temperature datasets are clearly a moving target. So while I’m sure this latest analysis from NOAA will be regarded as politically useful for the Obama administration, I don’t regard it as a particularly useful contribution to our scientific understanding of what is going on.
https://science.house.gov/sites/republicans.science.house.gov/files/documents/HHRG-114-SY-WState-JChristy-20160202.pdf I am John R. Christy, Distinguished Professor of Atmospheric Science, Alabama’s State Climatologist and Director of the Earth System Science Center at The University of Alabama in Huntsville. I have served as Lead Author, Contributing Author and Reviewer of United Nations IPCC assessments, have been awarded NASA’s Medal for Exceptional Scientific Achievement, and in 2002 was elected a Fellow of the American Meteorological Society. It is a privilege for me to offer my analysis of the current situation regarding the temperature datasets used to study climate.
https://bobtisdale.wordpress.com/2016/07/19/june-2016-global-surface-landocean-and-lower-troposphere-temperature-anomaly-update/ Even though the changes to the ERSST reconstruction since 1998 cannot be justified by the night marine air temperature product that was used as a reference for bias adjustments (See comparison graph here), and even though NOAA appears to have manipulated the parameters (tuning knobs) in their sea surface temperature model to produce high warming rates (See the post here), GISS also switched to the new “pause-buster” NCEI ERSST.v4 sea surface temperature reconstruction with their July 2015 update.