
> From the WeatherWatch archives
Track likely ash clouds from Mt Tongariro using this simple interactive map.
This map shows the likely flow of ash cloud when the winds are blowing from certain directions. Generally speaking winds this week will be light from the westerly quarter.
At the time of the eruption (1:30pm, Wednesday) winds were blowing from the SW at just 13km/h. Using our interactive maps below you’d select both southerly and westerly quarter to see the regions impacted (although mostly the westerly quarter map will be relevant this week).
Winds are light at the moment – so any ash movements will be slow.
This interactive graphic was provided by WeatherWatch.co.nz and designed by nzherald.co.nz
– Homepage image / GeoNet
– Graphics and maps by WeatherWatch.co.nz / nzherald.co.nz
Comments
Latest Video
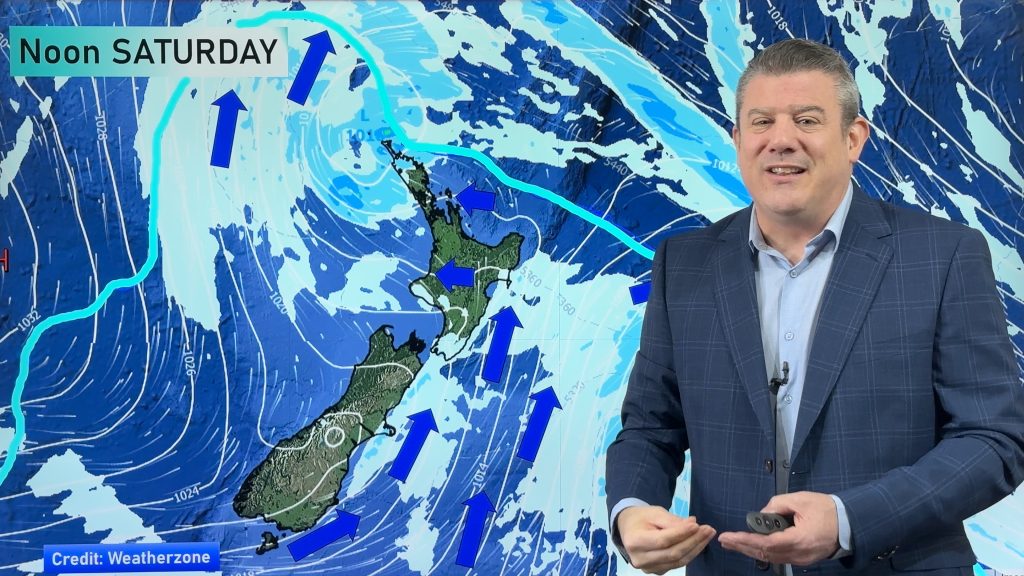
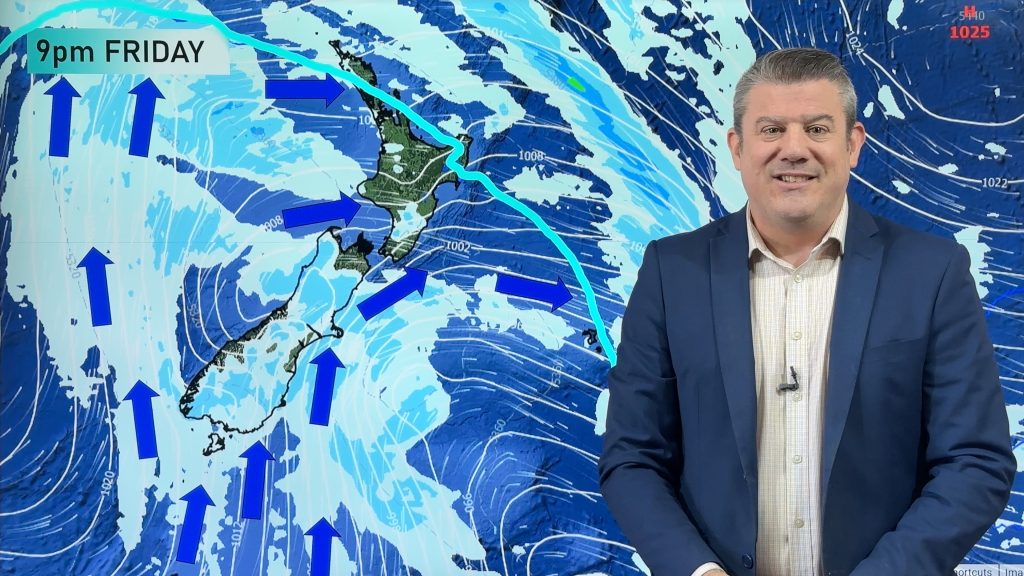
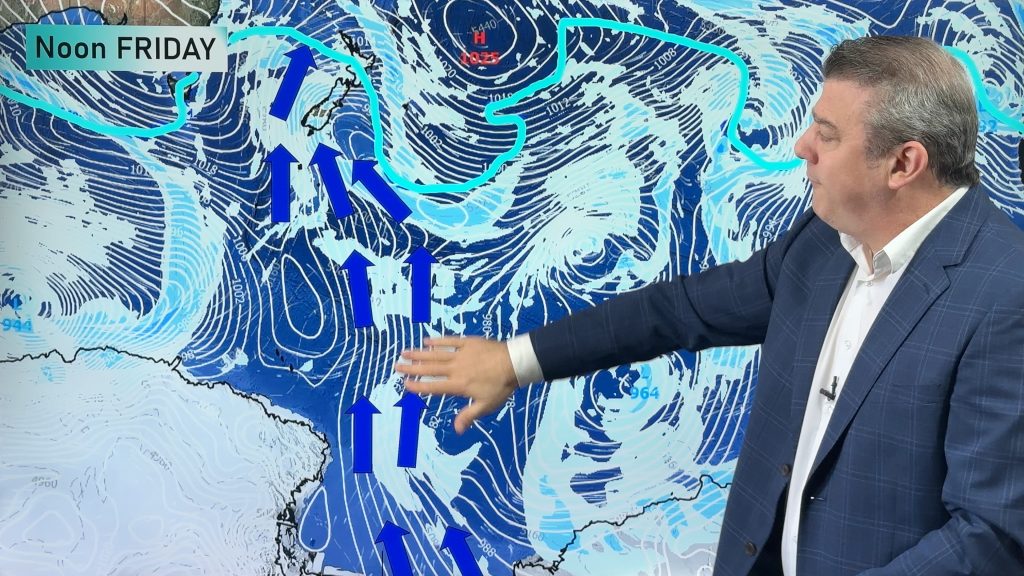
Cold weekend, frosts return with high pressure, then a low late next week
The subantarctic airflow spreads over NZ today/tonight and into Saturday, dropping temperatures nationwide. Snow flurries are possible today to lower…
Related Articles
Cold weekend, frosts return with high pressure, then a low late next week
The subantarctic airflow spreads over NZ today/tonight and into Saturday, dropping temperatures nationwide. Snow flurries are possible today to lower…
Wintry burst of weather: Snow, squally showers then sunshine & frosts
A polar change (another one!) arrives on Friday for the South Island and goes nationwide on Saturday, leaving NZ under…
Antarctic southerly for parts of NZ Fri & Sat
For the first time this year a southerly from off Antarctica is heading towards the South Island, followed by more…


Doug on 26/11/2012 12:50am
This is irresponsible and inaccurate. The only sources for credible volcanic ash information are GNS, the CAA and vaac.metservice.com.
You may despise the Met but they are the authority and are actually qualified to produce and disseminate this type of information.
hitadmin on 26/11/2012 2:21am
Hi Doug,
This isn’t irresponsible – it’s a basic guide for the general public. We don’t despise MetService – we have issues with them charging for content the public has already paid for. This is a very basic guide and has helped the public – if MetService want to make these graphics and make them easy for everyone to read then we will publish those instead. At this stage they don’t provide a service for the everyday public with ash – only technical information for airlines.
Kind regards
Philip Duncan