First week of November – Where is wetter/drier than average (+Maps)
28/10/2016 1:00am

> From the WeatherWatch archives
The first working week of November looks fairly average with rain and showers falling in the usual places and temperatures about average too.
After a wetter than usual end to September and start to October the North Island has finally started to dry back out to normal now. Not for everyone – Hawke’s Bay, especially northern Hawke’s Bay, remains wetter than average.
In the South Island it’s the Nelson area that is seeing wetter than average conditions – a theme that has been around for the past few months and doesn’t look set to stop anytime soon.
Canterbury is still drier than average – but showers and downpours recently have helped make some properties a little closer to average which is a positive.
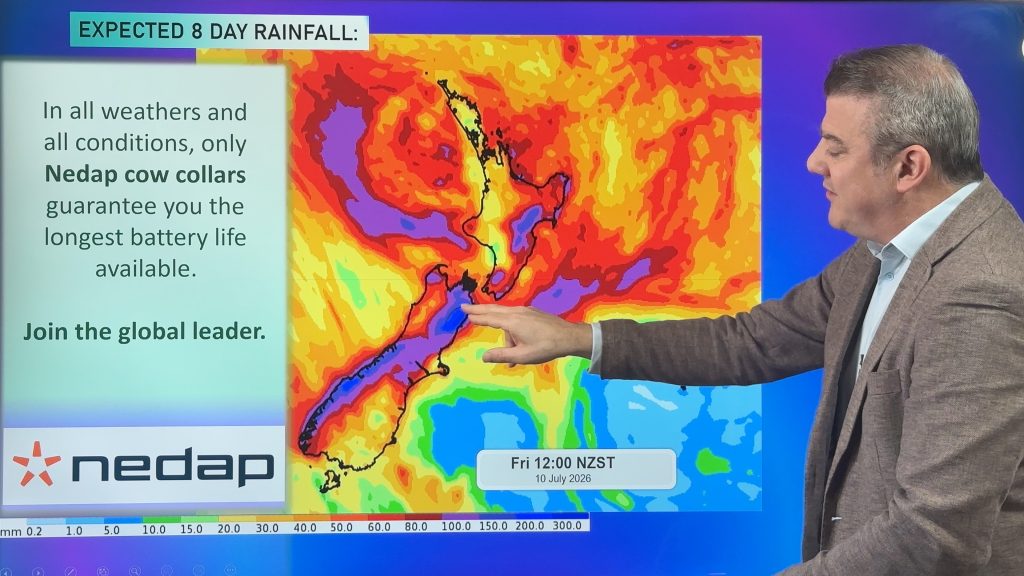
WETTER THAN AVERAGE NEXT 7 DAYS:
Over the next seven days this current pattern remains similar – generally speaking we may see a little more than average rainfall around the top of the South Island again, especially Nelson, also parts of the West Coast and also around East Cape in the North Island. Downpours in Hawke’s Bay look more average – but perhaps still above average in the ranges.
DRIER THAN AVERAGE NEXT 7 DAYS:
Canterbury, Wairarapa, Manawatu, Wanganui, Northland and parts of Auckland may all be drier than average – but that does not mean dry. We still have showers in the forecast for the next 7 days – but the trend in these regions is heading towards slightly drier than average.


– Images / (pink/red indicates drier than average, blue/purple indicates wetter than average. White = average)
– Data courtesy of the US Govt (this is because NIWA sends us legal threats if we use tax funded data from NZ, even though we have all collectively paid for it).
– WeatherWatch.co.nz
Latest Video
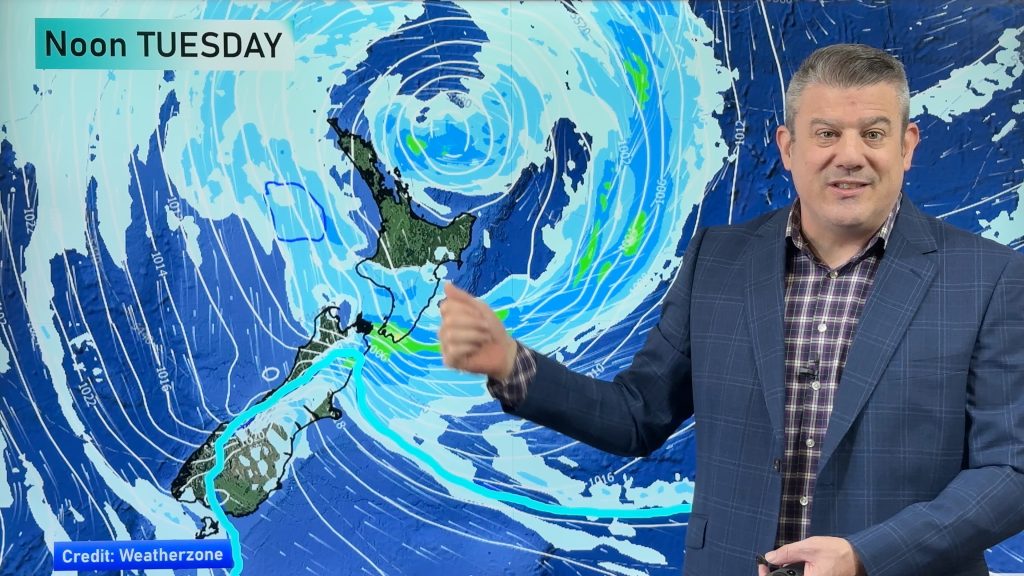
Wintry weather coming: Snow, rain, wind & sunshine
A cold front is moving into NZ from Friday to Sunday with low pressure developing west of NZ and then…
Related Articles
Polar airflow + northern low = pockets of heavy rain & snow
A colder change is coming – and so too is a large low which will develop and grow over northern…
Wintry weather coming: Snow, rain, wind & sunshine
A cold front is moving into NZ from Friday to Sunday with low pressure developing west of NZ and then…
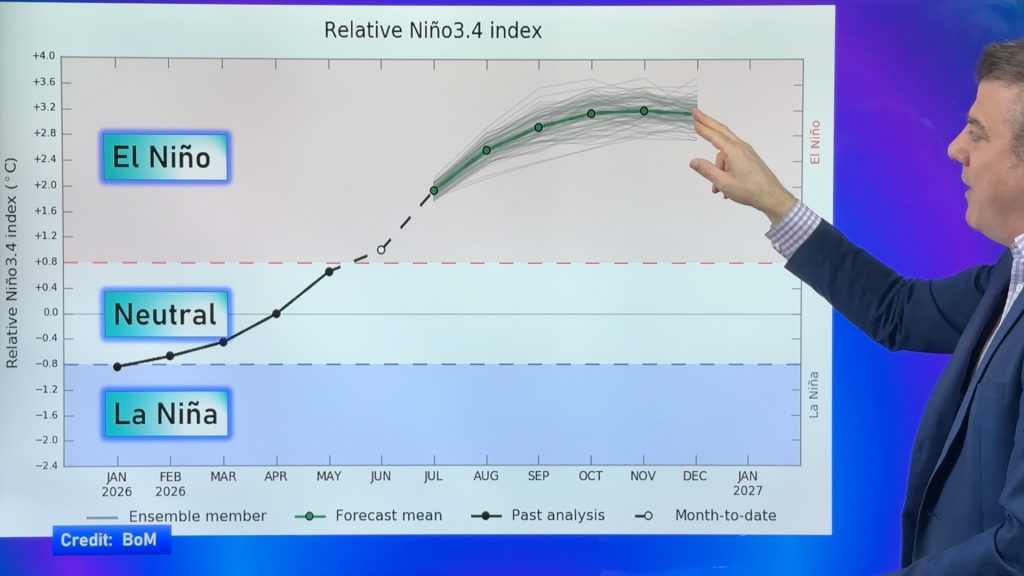
ClimateWatch: JULY outlook & what El Niño means for NZ
El Niño is officially here and still getting stronger in the months ahead, but it’s harder to notice its effects…

