Ways to get fewer nasty surprises when it comes to wet weather that is (or isn’t!) forecast
20/10/2025 9:48pm

REPOST from our Education Pages — It’s always interesting when we get a complaint about a rain forecast, just how often the person complaining hasn’t looked at the ‘big picture’ or read the ‘fine print’. We have the most accurate forecast data in NZ, but that doesn’t mean it’s perfect. Understanding all the things that can affect your local forecast on the day itself really does help make for more accuracy.
While globally rain forecasts are increasingly becoming more accurate and more localised, the terrain across NZ’s regions is so varied that rain totals and showers do often differ quite a bit from farm to farm, orchard to orchard, suburb to suburb, island to island.
Also, a lack of free open public weather data (radar and observations) from NZ Government agencies NIWA and MetService means forecasts from all providers in NZ don’t automatically absorb real time radar and rainfall totals – so here’s how to manually get around that and make for fewer nasty surprises.
There is ‘fine print’ in forecasts – and when you look at it, forecasts come to life in a far more useful way.
If rain matters that much to you then the couple extra minutes to take the few steps below will really make a big difference.
If you follow all these steps, you’ll have FAR FEWER FALSE ALARMS!
- Step 1: Look at the Weather icons. You can see when any RAIN SYMBOL shows up. First indicator of wet stuff (and means the chance of wet weather is above 30%).
- Step 2: Check the Text Forecast. Here you can see what sort of ‘precipitation’ (wet stuff that falls from the sky) is coming: Ie, Rain, showers, hail, graupel or snow, etc.
This is where most people stop. They’ve seen the wet weather icon, or “Rain developing” in the forecast.
Surely that’s enough? Not even close!
- Step 3: What is the % (chance of) rain? If it’s below 60% that doesn’t bode well for being an overly wet day (unless it’s a random thunderstorm or localised downpour. Even at just 10% or below a heavy moment of rain is possible).
- Step 4: What is the rainfall total for that day? If less than 20mm, that’s usually a “low” amount of rain or showers. 20 to 40mm would be more moderate to high and 40mm+ is high rainfall. Sometimes, under 10mm may not even occur as you’re really in the weeds of accurately tracking borderline areas of rain or showers across a hilly island nation like ours, but it’s still helpful to know.
- Step 5: Now you know how much rain is likely coming – how is it spread? In one hour? Or many hours across the day? Daytime or nighttime? At RuralWeather.co.nz and our new App you can visually see the rain in graph form, hour by hour, for 10 days out. It’s a great way to get a ‘snap shot’ of when the rain starts, peaks and ends. Keep it simple.
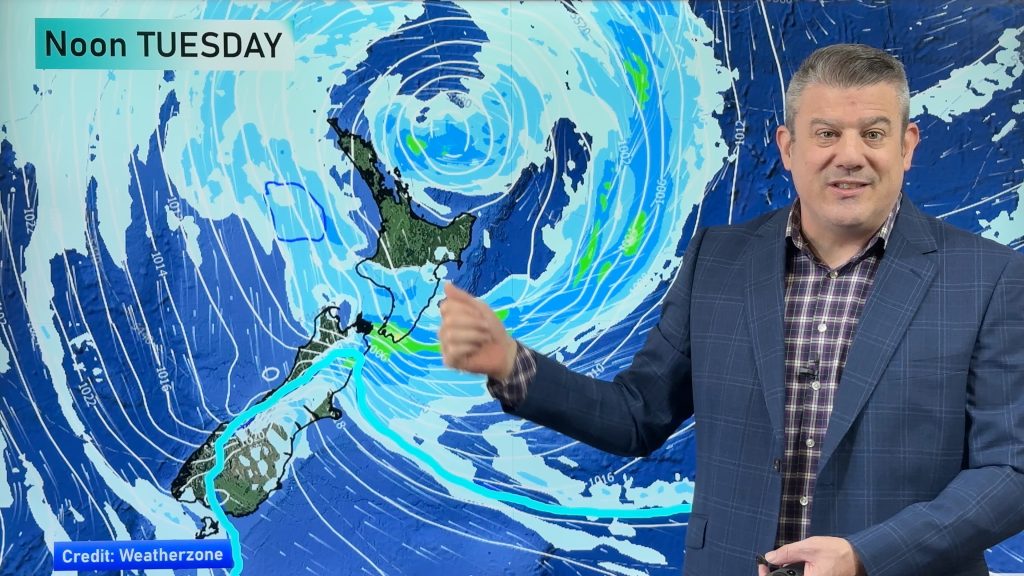
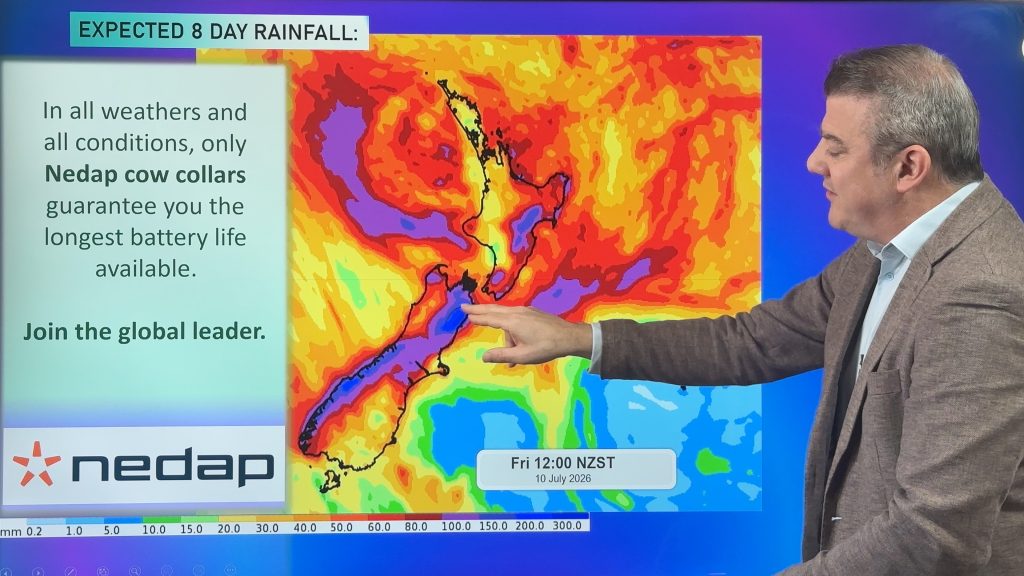
- Step 6: It’s all very well knowing what is forecast in your area – but what about the area next to you? It’s important to see the RAIN MAPS to get your head around where the peak rain will be across NZ and to see if you’re in the ‘thick of it’ or just on the fringes (being on the fringes means a higher chance of missing out on the forecast rain – or maybe getting a surprise downpour on what looks to be a dry day and this can often catch people by surprise if not taking this step to see surrounding wet weather risks to the region you’re in).
- Step 7: Watch our weekday weather videos, to get full context. Here our head forecaster Philip Duncan explains the type of rain that may be showing up, helping make sense of what may be forecast and why some forecasts may change. We get far fewer complaints about our forecast rain accuracy from people who follow our daily videos as it gives context to your 10 day forecast. (We strongly suggest watching our week-day weather videos along with your 10 day forecast up on your phone or computer screen, to help bring it to life and make more sense of it).
- Step 8: Look for instability. That’s basically being underneath, or near, any low pressure zone or weakened front as this means rain forecasts can “break” – along with the direction of airflow (which can change a lot when the centre of a low is over you or near by) – and when the airflow moves/shifts over mountains and ranges it and can then break the rain forecasts (lifting totals for some, dropping totals for others). Quite a few moving parts! So this is when using the rain radar is critical. A thunderstorm is a great example of instability and unexpected rainfall – sometimes a thunderstorm can add 50mm+ on top of what was forecast. In the January 27, 2023, flood in Auckland the Severe Thunderstorm added 200mm+ above what was forecast – our forecasts captured this a few hours before it started, but a day before it wasn’t “on the radar” as this is what instability looks like. Thunderstorms and daytime instability are still the most difficult rain events to accurately forecast in New Zealand in both maximum totals and precise location… and, of course, sometimes they don’t occur – leaving you with a dry day when you’re expecting more. NZ’s lack of open weather data from MetService and Niwa (weather data the public pays for) also limits the accuracy of ALL forecasters in the country. Our wings are clipped because the Government allows Niwa and MetService to commercialise real-time data and therefore block it from others to use (unlike all other modern nations on earth). Forecast accuracy is improving year on year, but tracking live on the rain radar on the day will help. Which leads to Step 9…
- Step 9: On the day itself, nothing beats monitoring the actual Rain Radar. Coupled with our hourly forecast graphs they can give you a good understanding of risks, start and end times and peak risks. Also, to monitor if the forecast wet weather is on time, late or early – or falling apart. Sometimes on the day itself the rain radar shows where the rain band may be breaking apart – or where a new area of heavy rain may be forming. The radar is the most critical compenent to tracking weather on the day, along with our hourly rainfall forecasts.
All of these resources laid out in the steps above can be FREELY found at www.RuralWeather.co.nz, our FREE App, or at WeatherWatch.co.nz – they will help you better plan ahead.
Yes, rain and shower forecasts do certainly get it wrong from time to time, but you can significantly increase the accuracy of your local forecasts if you follow the steps above – you will get fewer nasty surprises. Over time those steps above become second nature and those that do it daily get less frustrated with forecasts when they don’t pan out as expected.
If rain matters that much to you then the couple extra minutes to take the few steps above will really make a big difference.


- WeatherWatch.co.nz / RuralWeather.co.nz
Comments
Latest Video
Wintry weather coming: Snow, rain, wind & sunshine
A cold front is moving into NZ from Friday to Sunday with low pressure developing west of NZ and then…
Related Articles
Polar airflow + northern low = pockets of heavy rain & snow
A colder change is coming – and so too is a large low which will develop and grow over northern…
Wintry weather coming: Snow, rain, wind & sunshine
A cold front is moving into NZ from Friday to Sunday with low pressure developing west of NZ and then…
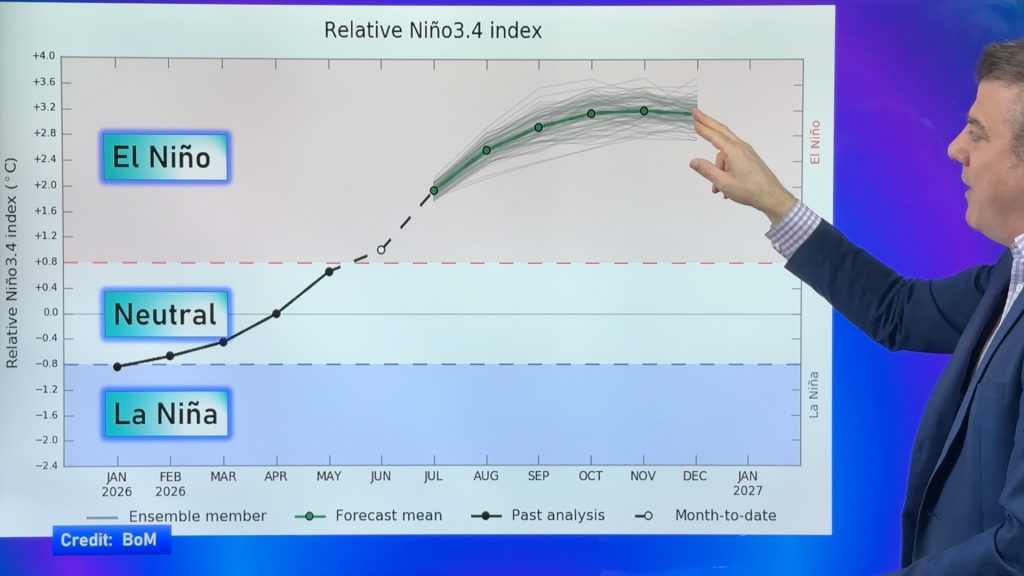
ClimateWatch: JULY outlook & what El Niño means for NZ
El Niño is officially here and still getting stronger in the months ahead, but it’s harder to notice its effects…


maree on 21/04/2025 6:49am
Im a weather watcher, obcessed with the weather really, you do the best you can with the information you have, I found your forcasting perfect over the hay making season , I got my hay in perfectly dry, very happy about that, the weather presently is so changeable, hard to get it perfect, but we as farmers have a rough idea of the trends. Kind regards
Kate on 11/01/2025 9:38am
Excellent article. Thank you.
Josh on 5/05/2024 9:00pm
i just found this article. i remember a couple flashes and rumbles at 10pm on january 27th last year. that was an extreme and deadly flooding event for auckland.
Obai Tashkandi on 11/02/2021 6:28am
Hi WW, what an awesome article! I love it and I learnt from it! Thank you so much! Although I have a question, when can the rainy days be locked in? Of course, 10 days are way too far, but when are you sure that it will rain, how far?
WW Forecast Team on 11/02/2021 6:18pm
Hey Obai, thanks for the thanks! Highest confidence is within 48 hours, but sometimes even a long range rain event can be pretty much locked in (more so in winter when things move with a bit more speed). If the chance of rain is over 60% more than 5 days out that’s a fairly high chance of rain (but rarely locked in that far out).
– WW
Ajay on 5/01/2023 11:40pm
Allow me to thank you for thanking and thanks from me too 🙂
Derek Butcher on 11/02/2021 12:00am
An excellent article and I learned a lot from it. My general weather knowledge has increased a lot since I started visiting this site a few years ago.
Thanks to WW.
Derek