2016 “hottest year ever” around the globe – Climate Agencies
6/01/2017 2:16am

> From the WeatherWatch archives
Last year was the hottest ever record, according to a European climate agency and a US-based climate centre.
While not all of the world’s major climate organisations have yet officially announced 2016 was the warmest on the books, many scientists have already called the year a record-breaker.
On Monday, the National Institute of Water and Atmosphere (Niwa) is also expected to confirm last year was New Zealand’s hottest.
In a statement this week, Copernicus Climate Change Service (C3S) – part of the EU’s Copernicus earth observation programme – reported the first global analysis of the whole of 2016 had confirmed last year as the warmest on record.
Figures showed last year’s global temperature exceeded 14.8C, and was about 1.3C higher than typical for the middle years of the 18th century.
2016 was close to 0.2C warmer than 2015, which was previously the warmest year on record.
Countries agreed in Paris in 2015 to holding the increase in the global average temperature to well below 2C above pre-industrial levels and to pursue efforts to limit the temperature increase to 1.5C above pre-industrial levels, recognising that this would significantly reduce the risks and impacts of climate change.
But C3S found that global temperatures in February 2016 already touched the 1.5C limit, though under the influence of a strong El Nino, an intermittent event involving a period of warming.
Global temperatures still remained well above average in the second half of 2016, associated partly with exceptionally low sea-ice cover in both the Arctic and Antarctic.
C3S also found that most regions around the world experienced above-average temperatures during 2016.

Air temperature at a height of two metres for 2016, shown relative to its 1981-2010 average. Source: Copernicus Climate Change Service, ECMWF. (Credit: ECMWF, Copernicus Climate Change Service)
The largest differences in regional average temperatures were found in the Arctic but conditions were also extreme over southern Africa early in the year, over southern and south-eastern Asia prior to the summer monsoon, over the Middle East later in summer, and over parts of North America in summer and autumn.
Meanwhile, Dr John Christy, director of the Earth System Science Center at the University of Alabama, also reported 2016 had edged out 1998 by 0.02 to become the warmest year in the 38-year satellite temperature record.
Because the margin of error was about 0.10C, this would technically be a statistical tie, with a higher probability that 2016 was warmer than 1998.

Annual global air temperature at a height of two metres (left axis) and estimated change from the beginning of the industrial era (right axis). Sources: Copernicus Climate Change Service, ECMWF, for data from 1979; Met Office Hadley Centre, NASA and NOAA for blended data prior to 1979.
(Credit: ECMWF, Copernicus Climate Change Service)
But the main difference was the extra warmth in the Northern Hemisphere in 2016 compared to 1998.
“The question is, does 2016’s record warmth mean anything scientifically?” Christy said.
“I suppose the answer is, not really. Both 1998 and 2016 are anomalies, outliers, and in both cases we have an easily identifiable cause for that anomaly: a powerful El Nino Pacific Ocean warming event.
“While El Ninos are natural climatic events, they also are transient.”
In the study of climate, scientists were more concerned with accurately identifying long-term temperature trends than with short-term spikes and dips, especially when those spikes and dips had easily identified natural causes, he said.
In an interview with the Herald, Niwa climate scientist Dr Brett Mullan also pointed out it was the pattern and long-term trends that counted, rather than a single record, “even though people get excited about these things”.
“On the longer time-scale, New Zealand has warmed by almost 1C over the past century, and the 2016 record is further evidence of the fact that the globe is warming.
“We expect that high temperature records will continue to tumble in the future.”
Global and regional warming continued to push New Zealand’s temperatures up, but such record breakers are irregular, he said.
For example, over the past three summers: in 2013-14, Niwa reported no new records or near-records for mean temperature broken at either the high or low ends; in 2014-15, eight climate sites produced new high mean temperature records – or near-records – but no low mean temperature records; in 2015-16, 28 sites had new high mean temperature records but, again, no low mean temperature records.
– NZHerald
Latest Video
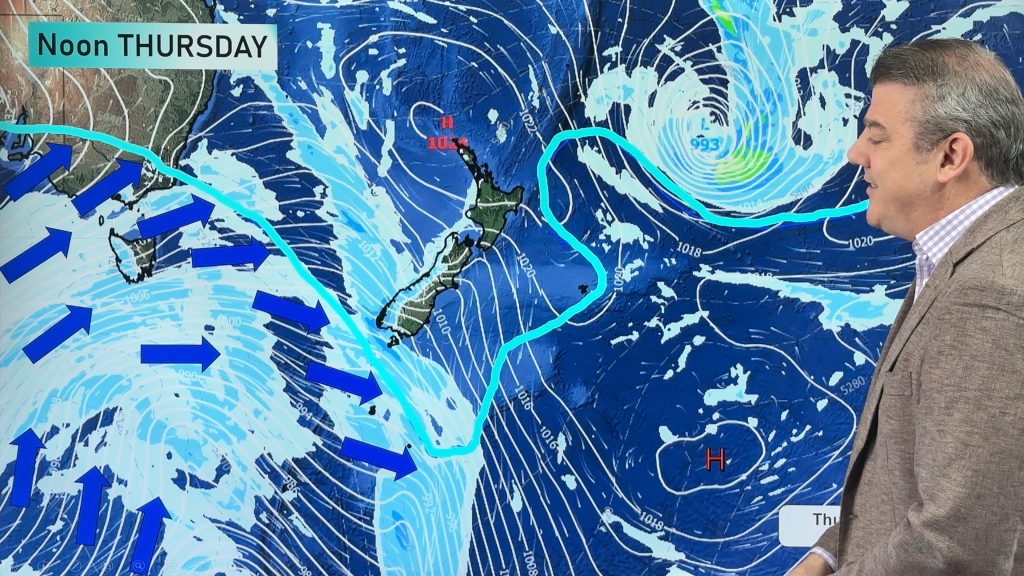
Polar airflows set to bring cold weekend to NZ
Nor-west winds will be building over parts of NZ going into Thursday with rain on the West Coast becoming heavy…
Related Articles
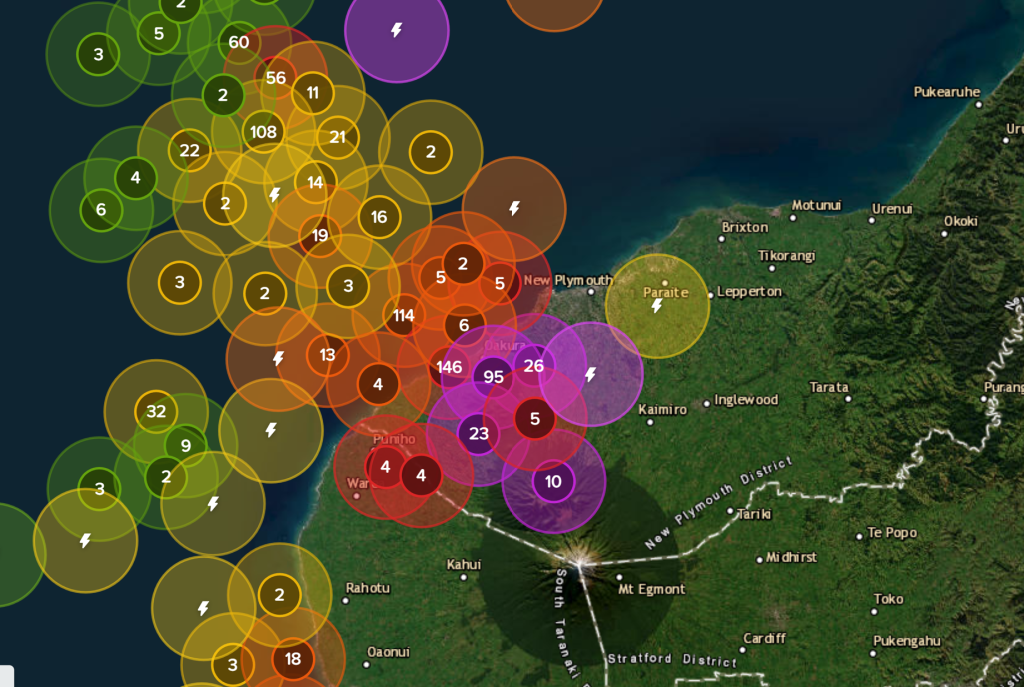
WeatherWatch App launches real-time local lightning tracker
A bolt out of the blue! WeatherWatch has launched a live, real-time lightning tracker, enabling Kiwis to gain access to data provided by the…
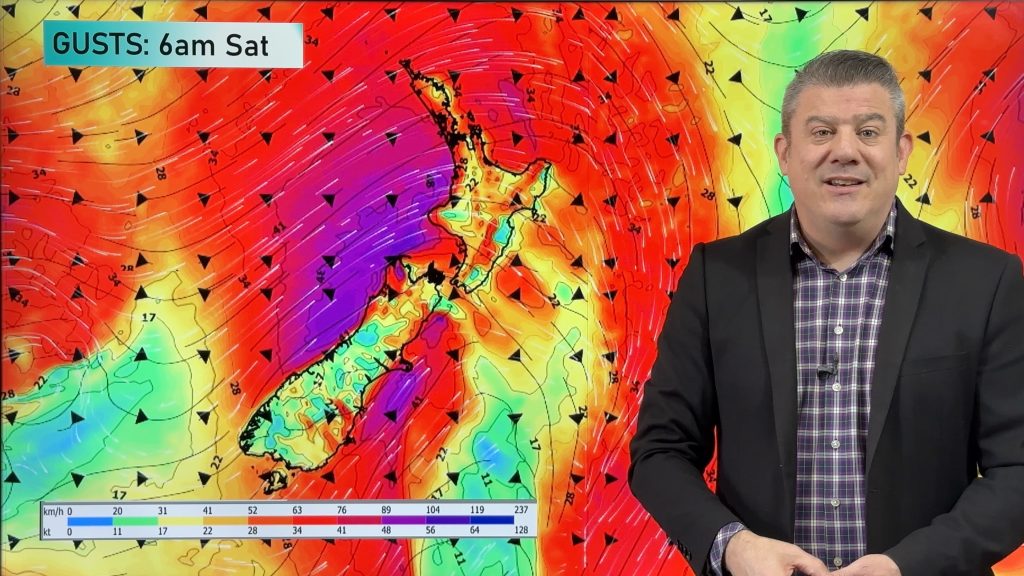
Wind, rain, showers & a noticeable temperature drop for all
It will be a colder weekend right across NZ as a sub-Antarctic southerly blows through, bringing frosts, snow flurries and…
Polar airflows set to bring cold weekend to NZ
Nor-west winds will be building over parts of NZ going into Thursday with rain on the West Coast becoming heavy…

