Rainfall and Pressure
Animated
Thumbnails
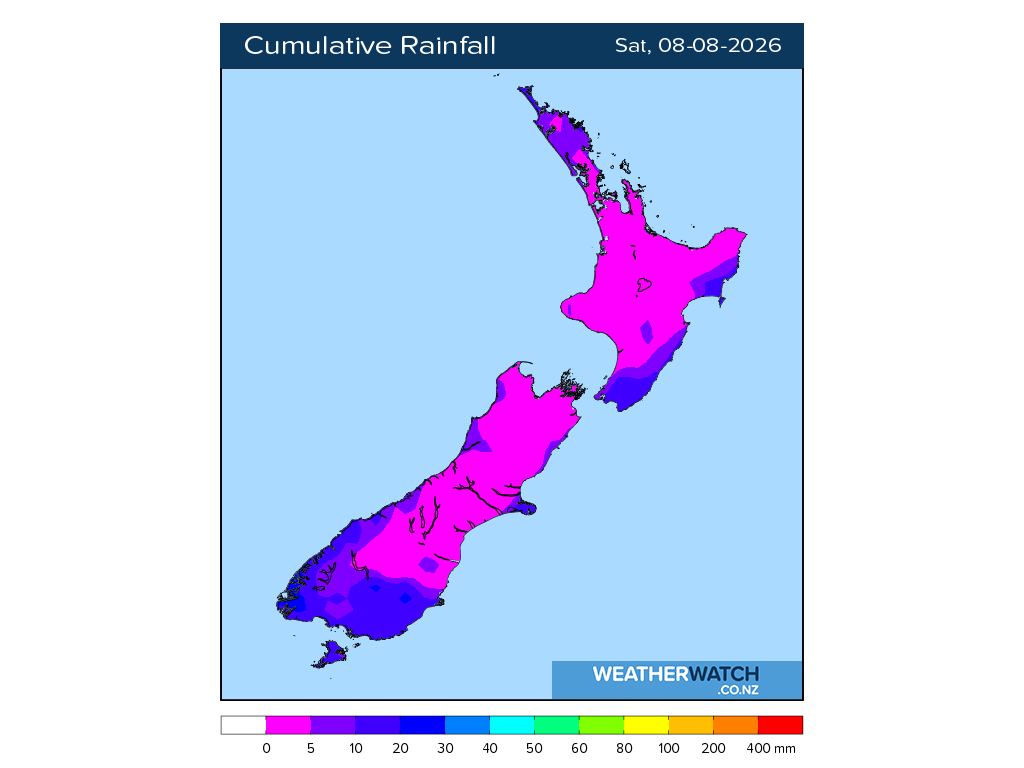
Map shows: Combined Total Precipitation (mm) in 6 hour segments from time listed and Pressure Reduced to Mean Sea Level (hPa).
GFS model data provided by NOAA.
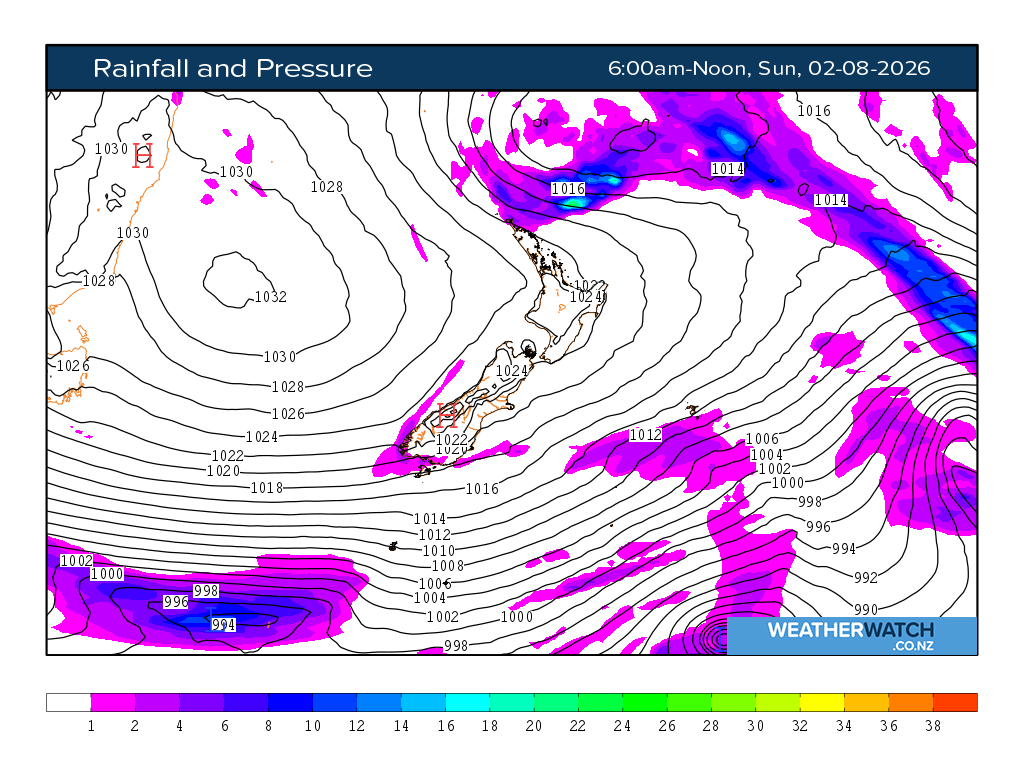
Map shows: Combined Total Precipitation (mm) in 6 hour segments from time listed and Pressure Reduced to Mean Sea Level (hPa).
GFS model data provided by NOAA.