
> From the WeatherWatch archives
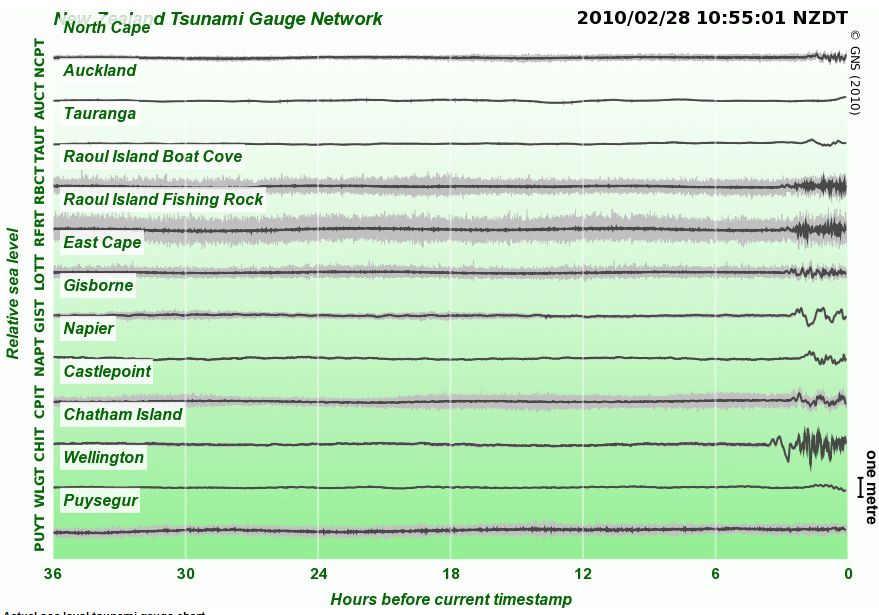
The image below represents a snapshot of the latest tsunami gauge recordings for operational instruments in the New Zealand region from GeoNet.
The timestamp shown at the top right of the diagrams below is the time when the images were last refreshed.
The previous 36 hours of sea level variations from all operational sites are displayed, oldest to most recent from left to right. Within the sampling period of one minute, the dark part of the trace shows the average sea level height, whilst the grey part shows the maximum and minimum values.
Comments
Before you add a new comment, take note this story was published on 27 Feb 2010.
Latest Video
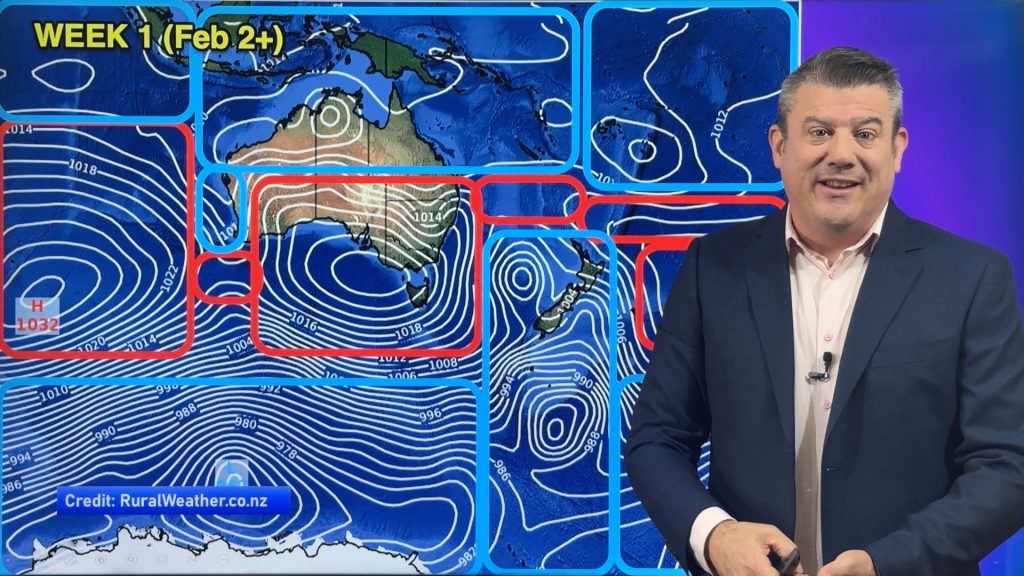
ClimateWatch: FEBRUARY outlook as highs & lows mix up a bit
The high pressure belt is a bit broken this month, as it was last month, meaning there will be further…
Related Articles
ClimateWatch: FEBRUARY outlook as highs & lows mix up a bit
The high pressure belt is a bit broken this month, as it was last month, meaning there will be further…
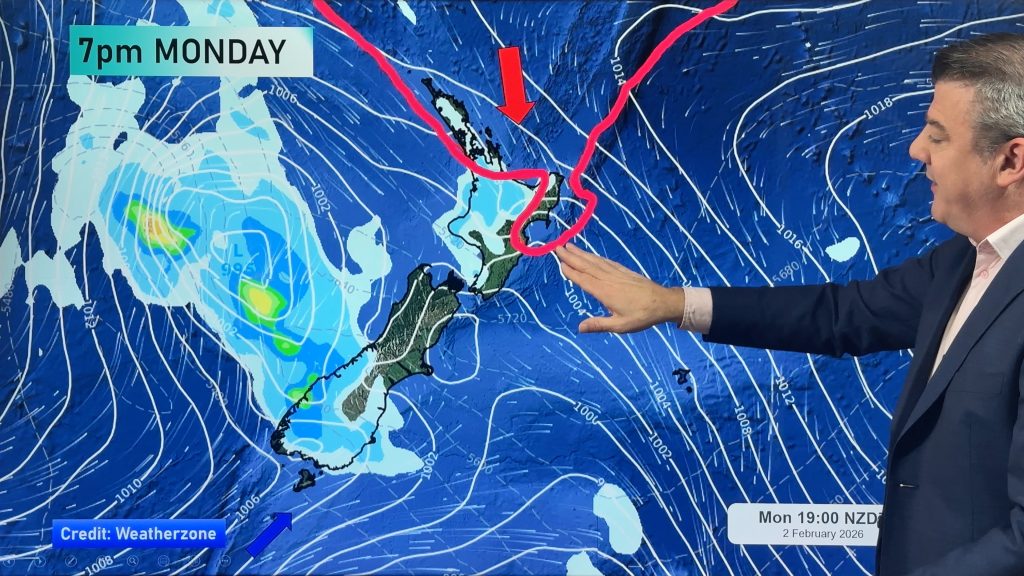
Low pressure crosses NZ on Tuesday, high pressure for many this long weekend
**Apologies for the visual problem in the first 5 seconds of the video**. Heat and humidity increases in northern NZ…

Meteors – Your Eyewitness Reports!
WeatherWatch.co.nz receives meteor reports from all over New Zealand and the globe, 24/7/365. **CASUAL COMMENTS**If you’ve seen something in the…


Add new comment